


An analysis of Alphabet and Microsoft earnings for the third quarter of 2026
One of the most effective tactics in war is to hold the initiative. That means not simply defending, but conducting active operations that force the enemy to keep reacting, regrouping and adapting to your moves. History is full of examples. In 1940 the German blitzkrieg in France rested on exactly this: fast armoured breakthroughs that gave the French command no time to organise a stable defence. We saw similar action in the first months of Operation Barbarossa, when Soviet forces were pushed back by mobile groups that chose the place and pace of each engagement themselves. Even in more recent conflicts, such as the opening phase of the 1991 Gulf War, the coalition kept the initiative through combined strikes that left Iraqi forces constantly playing catch-up.
Today Alphabet and Microsoft are waging a similar campaign in artificial intelligence and AI infrastructure. They are investing aggressively in data centres, GPUs and custom chips, forcing competitors, customers and even regulators to adapt to their pace. Their cloud businesses are growing at double- and triple-digit rates, while contracted but not yet delivered orders and remaining contractual commitments run into the hundreds of billions. On the battlefield these companies look like tanks breaking through enemy lines, delivering remarkable speed and firepower.
But tanks on the offensive inevitably start to take hits. Depreciation builds up, spare parts wear out and fuel reserves - in this case free cash flow - begin to run low. At Alphabet, operating cash flow no longer covers capital expenditure (capex), free cash flow (FCF) has turned negative for a second consecutive quarter and debt has risen. Microsoft still generates positive FCF, but it too has doubled its cash capex and warned that spending will keep rising. In both cases today’s AI infrastructure investment will turn into higher depreciation and energy costs in 2027.
The question is no longer just who holds the initiative, but who can sustain it before the fuel tanks run dry and the machines start to break down from overload. Energy and physical constraints are no longer just an added cost; they are starting to cap the very pace at which the tanks can advance. At both companies, shortages of power and equipment are already delaying the commissioning of new capacity, not just raising costs.
Alphabet (Google): revenue, capex and free cash flow
Revenue by segment - expected vs actual
| Line | Actual | Expected (consensus) | Comment |
|---|---|---|---|
| Total revenue | $127.6bn | ~$128.2bn (LSEG) | Slight miss |
| Search & other | $63.4bn (+12%) | ~$65.0bn (LSEG) | Clear miss; slowdown from 17% in the prior quarter |
| YouTube ads | $11.2bn (+9%) | ~$11.4bn (analyst estimates) | Slight miss |
| Google Cloud | $30.7bn (+103%) | ~$28.7bn | Big beat |
| Total advertising revenue | $82.0bn (+11%) | Above actual (analyst estimates) | Miss |
Search remains the largest and most profitable business, but its growth slowed. Management named foreign exchange as the biggest factor, followed by effects in specific verticals (retail, media and entertainment) and a tougher comparison base from late 2025, which took about 3 percentage points off growth. It also linked part of the slowdown to lower monetisation in AI Mode, without quantifying the effect. In absolute terms, Search added less than in previous quarters. Cloud contributed about 60% of the year-on-year increase in revenue, making the overall picture more dependent on a single segment. This is a lasting shift, not a one-off.
Unlike the European Commission fine or the unrealised loss on the SpaceX stake, which are one-off and partly non-cash, the slowdown in Search and the growing weight of Google Cloud are trends that will persist over the coming quarters. Much of the Cloud growth is already priced in. A genuine positive surprise would be not merely working through the backlog of contracted orders, but converting it into revenue without significant delays while holding margins despite energy constraints. If that happens over the next two or three quarters, the case for a self-sustaining advance gets stronger.
Costs and future margin pressure
Total costs and expenses rose 22% to $87 billion. Other cost of revenues increased 32%, driven by hardware for TPU systems, depreciation, content acquisition and infrastructure operating costs (including energy). Research and development expenses grew 36%.
Management warned of near-term pressure on Google Cloud margins from the use of third-party capacity. More importantly, capex of $51.4 billion will drive rising depreciation in 2027. Together with higher energy costs, this will weigh on operating income even if revenue keeps growing. The operating loss at the Alphabet level, mainly from shared AI research costs, was $7.7 billion. The tank keeps advancing, but every mile adds wear to the tracks and burns more fuel. If the Search slowdown deepens, the company will have to rely even more on debt and new share issuance to keep up the pace. That would turn today’s capex from a tool for holding the initiative into a source of additional cost.
Capex, funding and the cash cycle
Capex: $51.4 billion (below the roughly $55.1 billion analysts expected). About 65% went to servers and networking equipment and 35% to data centres. Guidance for 2026 remains $195-205 billion, and a significant increase is expected in 2027.
Operating cash flow ($42.3 billion) does not cover capex. The gap is funded mainly by senior unsecured notes (about $28.7 billion in net proceeds) and at-the-market share sales (about $12.4 billion in net proceeds). Long-term debt rose to $125.1 billion from $21.6 billion a year earlier. Cash and marketable securities total $265.1 billion, but $90.4 billion of that is held in equity securities. The share sales create a risk of dilution for existing shareholders. Future purchase commitments ($924 billion) and signed leases that have not yet commenced ($152 billion) are further obligations.
The build-up of TPU system inventory changes the cash cycle: cash goes out before it comes back as recognised revenue. This is a different model from simply building out the company’s own infrastructure. A Cloud backlog of $561 billion (just over 55% expected to be recognised within 24 months) is a strong signal, but it carries the risk of delays or renegotiation. The larger the backlog, the more sensitive the company becomes to any delay in delivery - just like a tank that has pushed deep into enemy territory but depends on an uninterrupted supply line. If commitments slip, they become an obligation without matching revenue, while the fuel keeps burning.
Cash flows and negative free cash flow
Operating cash flow was $42.3 billion (down 13%). FCF was minus $9.1 billion (a second consecutive negative quarter; $19.7 billion over the trailing twelve months). Additional pressure came from paying a $5.2 billion European Commission fine. The loss from remeasuring equity securities, mainly the SpaceX stake (about $8.7 billion), hit net income but is unrealised. The distinction matters: the fine is a one-off cash outflow, while the SpaceX loss is non-cash. The core problem remains that operating cash flow does not cover capex.
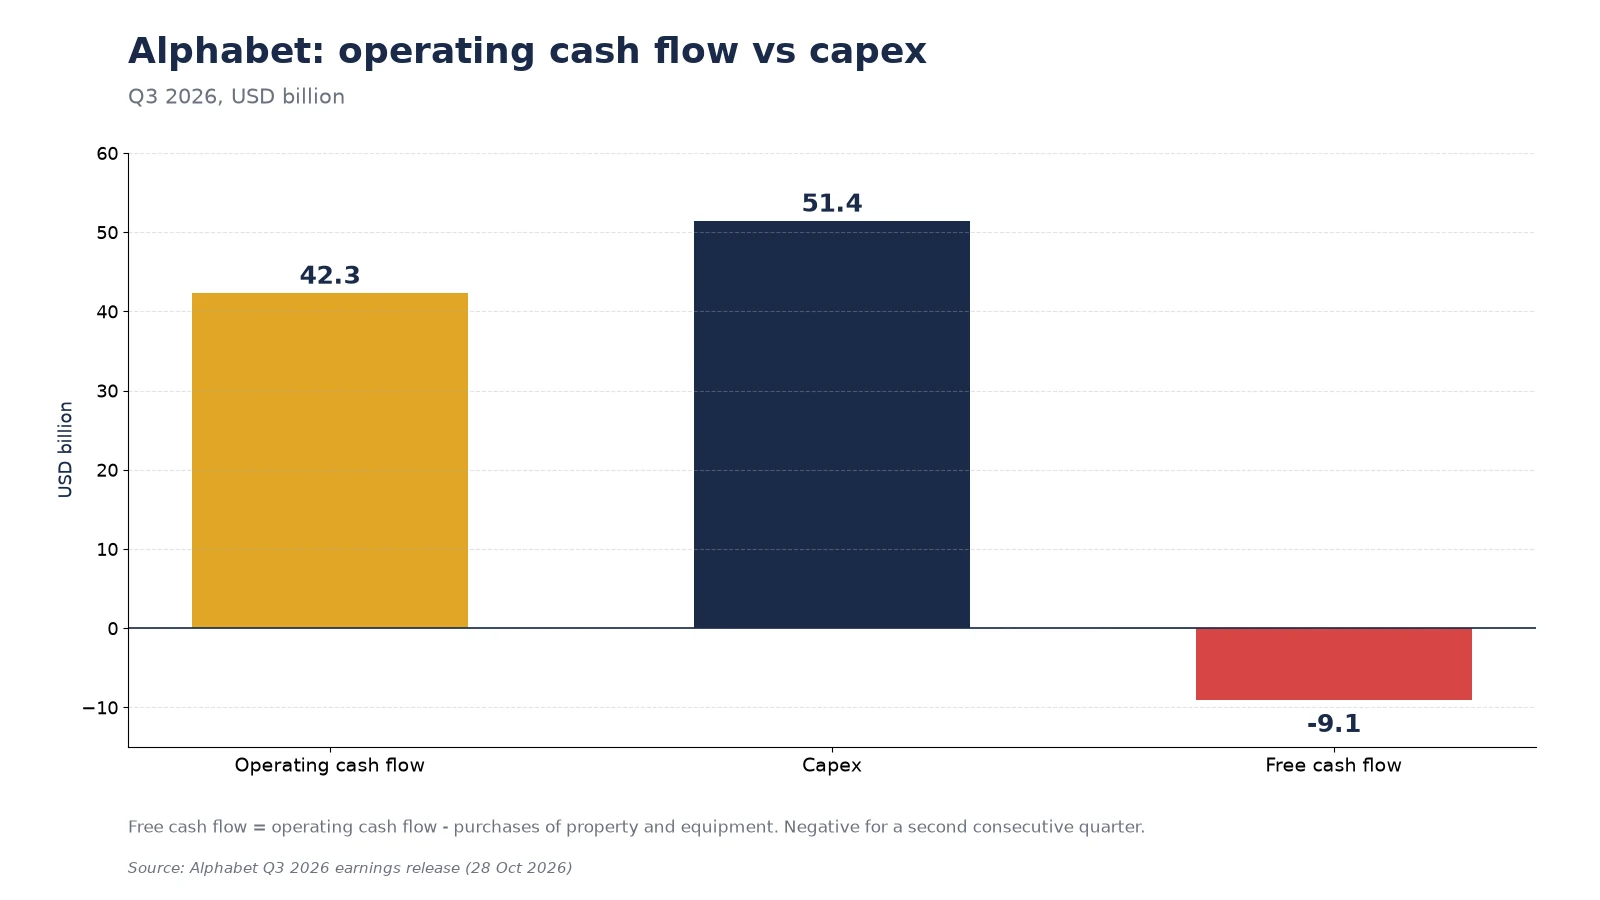
The chart shows clearly that capex now exceeds operating cash flow. This is not a temporary effect of the fine but the result of a decision to keep the initiative at a pace the core business can no longer fully fund on its own.
Management outlook
Sundar Pichai highlighted the fastest growth in Search queries in five years and 1 billion Gemini users. CFO Anat Ashkenazi kept the capex range unchanged and warned of a significant increase in 2027, as well as margin pressure. Thomas Kurian confirmed strong demand for TPUs. The company sees 2027 as a period of AI-driven productivity, but capex will keep rising at the same time.
Red flags at Alphabet
The risks are not equal. Over the next 12-18 months the biggest are the Search slowdown and negative FCF, because they already affect the valuation and the company’s ability to fund the advance without issuing more shares or debt. Rising depreciation and energy constraints will become more visible in 2027. Overcapacity risk and reliance on third parties are longer-term, but they are already limiting the pace. If the Search slowdown deepens, it adds to the pressure on FCF and forces the company to lean even more on debt and share issuance. That makes the two risks interlinked.
Search slowdown with no clear quantification of the AI Mode effect.
Search remains the company’s largest and most profitable business, and any lasting slowdown reduces the ability of the other segments to offset the cost of AI infrastructure. If Search growth stays below 10% for two consecutive quarters, the case that the core business can fund capex weakens significantly and the likelihood of further shareholder dilution rises.
Negative FCF and a sharp rise in debt.
The company no longer funds its investment from operating cash flow alone but relies on debt and share issuance, which raises financial risk and dilutes shareholders.
Rising depreciation and energy costs in 2027.
Today’s capex will turn into higher costs on the income statement in the years ahead and could squeeze margins even as revenue keeps growing.
Physical constraints and reliance on third-party capacity.
This is a red flag because shortages of power, land and equipment are already forcing the company to use external capacity, which reduces control over margins and over how quickly capacity turns into revenue.
Overcapacity risk if demand for AI infrastructure slows.
If demand weakens, the large investments in data centres and equipment will earn lower returns and leave capacity idle.
Volatility from equity investments (SpaceX).
Large swings in the value of equity investments have an unpredictable impact on net income and are unrelated to the core business. This is, however, more of a one-off risk.
Investment view on Alphabet
Alphabet is a powerhouse in AI infrastructure and technology. Cloud growth and a $561 billion backlog are impressive, and vertical integration with TPUs gives it an edge. However, negative FCF, rising debt and future margin pressure call for clear evidence that capex is turning into sustainable revenue and cash flow.
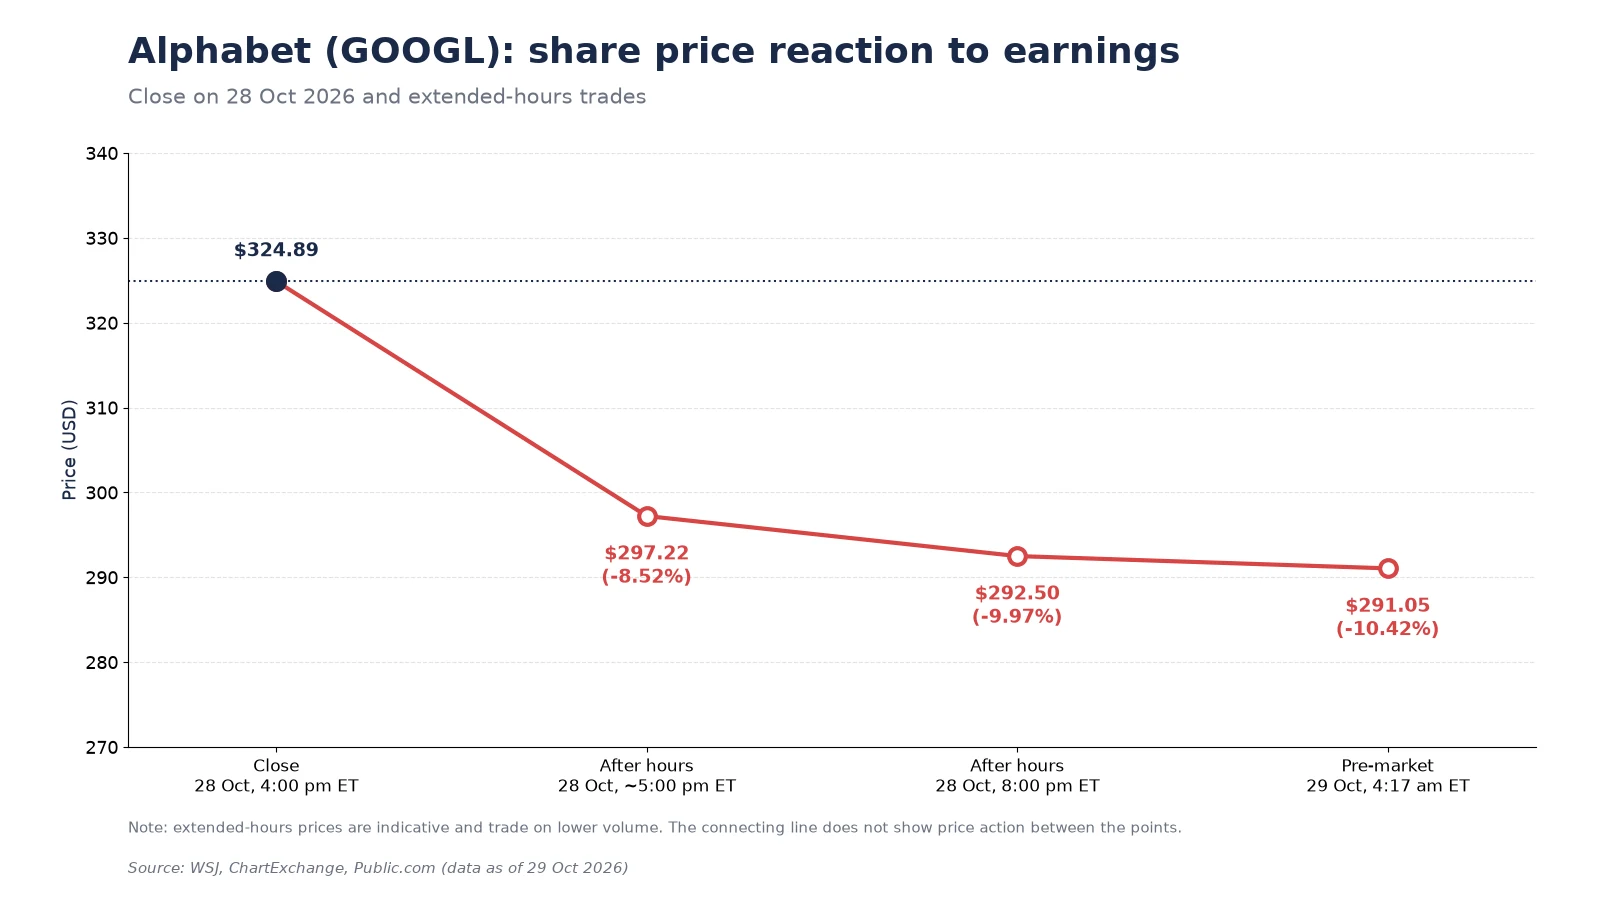
At a close of about $325, the trailing P/E is around 16-17, while analysts estimate the forward P/E to be higher. The FCF yield is very low (about 0.5%). The average 12-month analyst price target is about $424 according to TipRanks as of 29 October, with a consensus Strong Buy rating, but it does not yet reflect post-earnings revisions. After the report several banks cut their targets, for example UBS to $332, Bank of America to $380 and Barclays to $405. The stock fell about 10% in after-hours and pre-market trading, reflecting the reaction to negative FCF and the miss in Search.
| Metric | Alphabet (GOOGL) |
|---|---|
| Close (28 October) | $324.89 |
| Move after earnings | Down about 10% (to ~$292) |
| Trailing P/E | ~16-17 |
| Forward P/E | Higher than trailing (analyst estimates)** |
| FCF yield | ~0.5% |
| Consensus 12-month target | ~$424 (TipRanks, 29 Oct, before post-earnings revisions) |
| Target range | New post-earnings targets: $300 (DA Davidson) to $425 (BMO) |
| Analyst rating | Strong Buy |
| Upside to consensus target* | ~30% from close |
*Upside is calculated from the closing price. Extended-hours moves change the current risk/reward.
**The trailing P/E is lower than the forward P/E because trailing twelve-month earnings include a one-off gain of about $99 billion on equity stakes (SpaceX, Anthropic) in the second quarter of 2026.
Position guidance: for an existing long-term position it makes sense to hold, while closely watching Search growth and Cloud margins over the next two quarters. Trimming is warranted only if Search growth stays below 10% for two consecutive quarters or if the Cloud margin contracts by more than 300 basis points because of third-party capacity and energy costs. We could add if Search returns to growth above 14-15% and Cloud keeps converting its backlog into revenue without significant delays and with stable margins. A new position is better built in stages over time, after confirmation that capex is starting to turn into more sustainable FCF, or on a deeper correction that improves the risk/reward. Aggressively increasing exposure at current levels carries a higher risk of disappointment in 2027.
Microsoft: Azure, capex and free cash flow
Revenue by segment - expected vs actual
| Line | Actual | Expected | Comment |
|---|---|---|---|
| Total revenue | $92.3bn (+19%) | ~$90.7bn (LSEG) | Beat |
| Azure | $33.2bn (+48%) | Growth ~45% (analyst estimates) | Beat |
| Microsoft Cloud | $63.9bn (+30%) | n/a | Acceleration |
| Agents and Infra | $76.8bn (+25%) | ~$75.6bn (Bloomberg) | Beat |
| Devices and Consumer | $15.5bn (-3%) | ~$15.0bn (Bloomberg) | Slight beat, but declining |
Windows OEM and Xbox continue to shrink as a share of revenue. Azure is the biggest asset and the main growth engine. Unlike Alphabet, where Search is the core, Microsoft’s dependence is spread out, although about 11% of revenue is tied to OpenAI, according to a Goldman Sachs analyst estimate cited on the earnings call. This makes Azure less vulnerable to a one-off drop in a single advertising channel, but more sensitive to changes in the terms of one key partnership.
Much of the Azure acceleration is already priced in. A genuine positive surprise would be not just sustaining growth above 45%, but also improving capacity efficiency despite delayed deliveries and energy constraints. At Microsoft the advance is increasingly funded by the cloud business itself, which makes the company more sensitive to any delay in delivering on its remaining performance obligations (RPO). The tank advances on its own fuel, but that fuel depends on customers meeting their commitments on time.
Costs, capex and the impact ahead
Capex including finance leases was $45.2 billion; cash capex was $39.4 billion (just over double the roughly $19.4 billion a year earlier). About 75% went to shorter-lived assets (CPUs, GPUs, memory and storage). Capex came in below the company’s own guidance because of delayed third-party deliveries. Microsoft expects more than $50 billion next quarter and about $170 billion for calendar 2026, with spending accelerating in the second half.
Operating expenses rose moderately. Higher efficiency across the GPU and CPU fleet helped monetise capacity better. Even so, rising depreciation and energy costs will weigh here too in 2027. Doubled cash capex means margins will come under pressure even as revenue grows, unless capacity utilisation improves significantly. Bookings volatility, caused by large Azure contract commitments a year earlier, makes revenue less predictable and investment pacing harder to plan. Energy and physical constraints already act as a mechanism that shifts spending into the second half of the year and delays new capacity. This is not just a higher cost; it is a slower advance. If Azure growth slows, the higher capex will put even more pressure on margins, because depreciation will keep rising while revenue from the new capacity is pushed out.
Funding and cash flows
Operating cash flow was $58 billion (up 29%). FCF was $18.6 billion (down 27% year on year). Unlike Alphabet, Microsoft remained FCF-positive. The company returned $10.2 billion to shareholders through dividends and share buybacks. It has the flexibility to use debt or leases if needed, but for now it relies mainly on operating cash flow. Management expects FCF to remain positive in fiscal 2027.
RPO rose 73% to $677 billion, with bookings volatile because of large Azure contract commitments a year earlier. A large RPO balance is a strong demand signal, but it carries the same risk of delay as the backlog at Alphabet. The bigger the commitment, the more it matters whether customers honour it on schedule. If it is not delivered on time, it becomes an obligation without matching revenue, while the tank keeps burning fuel to hold ground it has already taken.
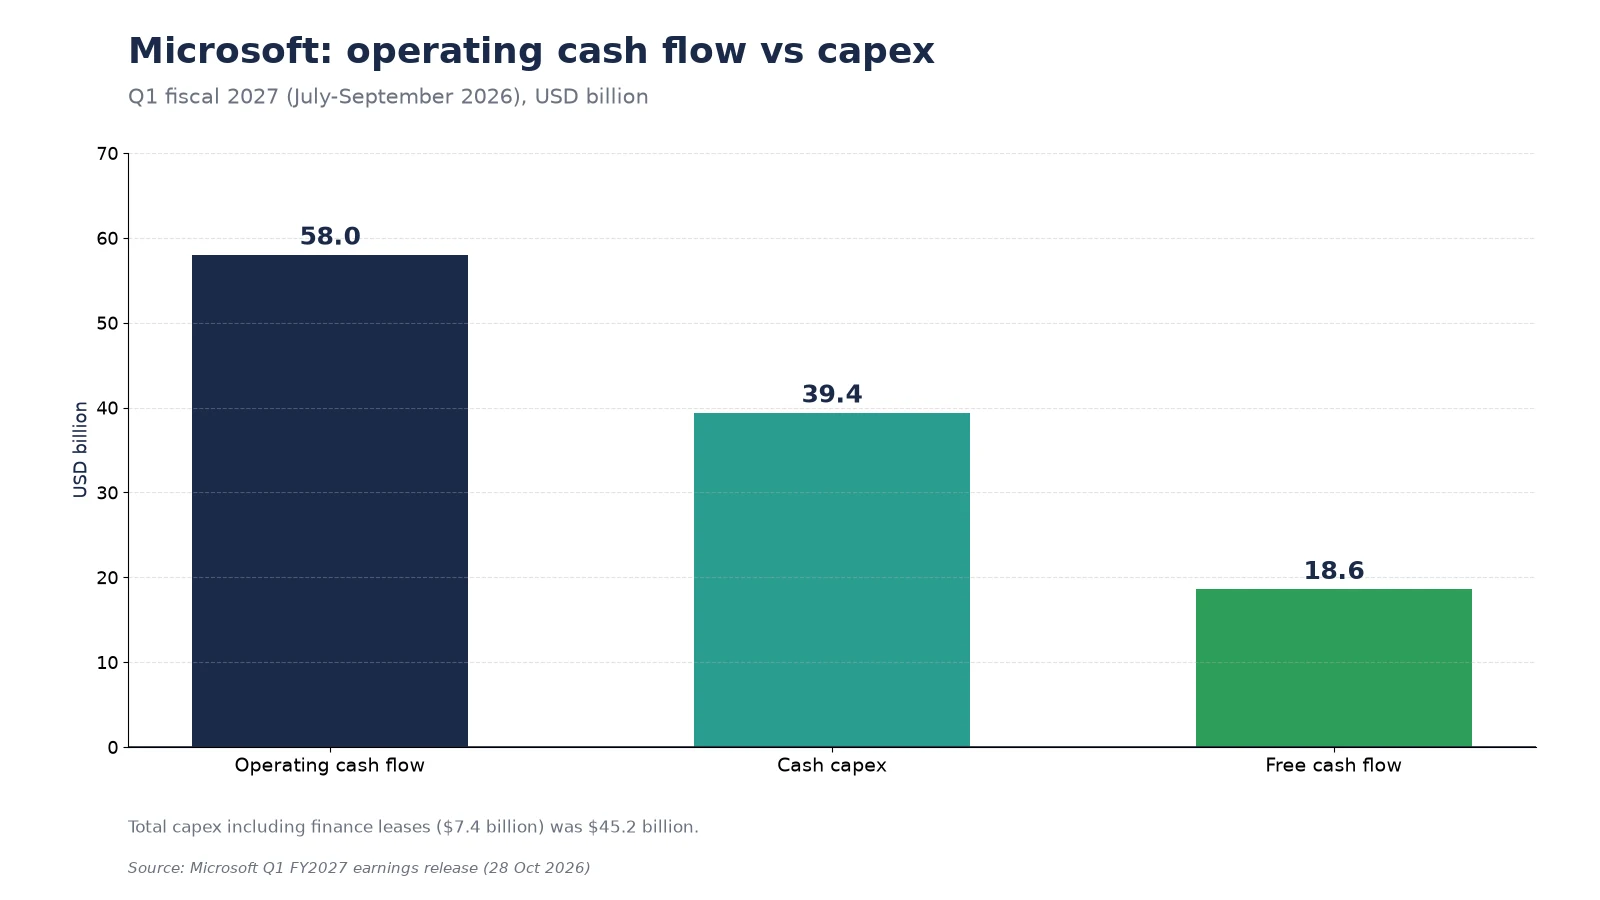
The chart shows that Microsoft still covers capex with operating cash flow and remains FCF-positive. That is an advantage over Alphabet, but doubled cash capex is already eating into the buffer and making the company more sensitive to any delay in turning capacity into revenue.
Management outlook
Satya Nadella and CFO Amy Hood confirmed that AI demand exceeds supply. Azure growth is expected to accelerate to 49-50% in constant currency. Capex will rise, but the company remains confident in long-term returns. Delayed third-party deliveries are shifting spending into the second half of the year. Revenue guidance for the second quarter: $96-97.1 billion (up 18-19%).
Red flags at Microsoft
At Microsoft, the biggest risk over the next 12-18 months is the combination of rising depreciation and physical constraints that could delay turning investments already made into revenue. Bookings volatility affects predictability, and the dependence on OpenAI is more serious than it first appears. Weakness in Windows and Xbox is less critical, because these businesses no longer drive overall growth. If Azure growth slows, it will amplify the pressure from rising depreciation and make the higher capex even heavier, because the company now funds the advance largely from the cloud business itself.
Weakness in Windows and Xbox.
The continued decline in these businesses shows that part of the portfolio is not benefiting from the AI wave and may keep weighing on overall growth.
Bookings volatility.
Large one-off commitments create swings in bookings and make future Azure revenue harder to forecast. This reduces confidence in the pace of investment.
Physical constraints and delayed deliveries.
The shortage of third-party capacity is already shifting spending and limiting how quickly the company can meet demand.
Rising depreciation in 2027.
This is a red flag because today’s investment in servers and data centres will increase depreciation next year and could squeeze operating margins. With cash capex doubled, the effect will be more pronounced.
Dependence on OpenAI (about 11% of revenue, according to a Goldman Sachs analyst estimate).
A significant part of cloud growth is tied to a single partnership whose terms and volume could change.
Overcapacity risk if demand slows.
If demand for AI infrastructure slows, investments already made will earn lower returns and leave capacity idle.
Investment view on Microsoft
Microsoft shows a healthier balance between growth and cash flow this quarter. Azure and Microsoft Cloud are clear winners, and positive FCF provides more flexibility. The new segment structure makes the AI business more transparent.
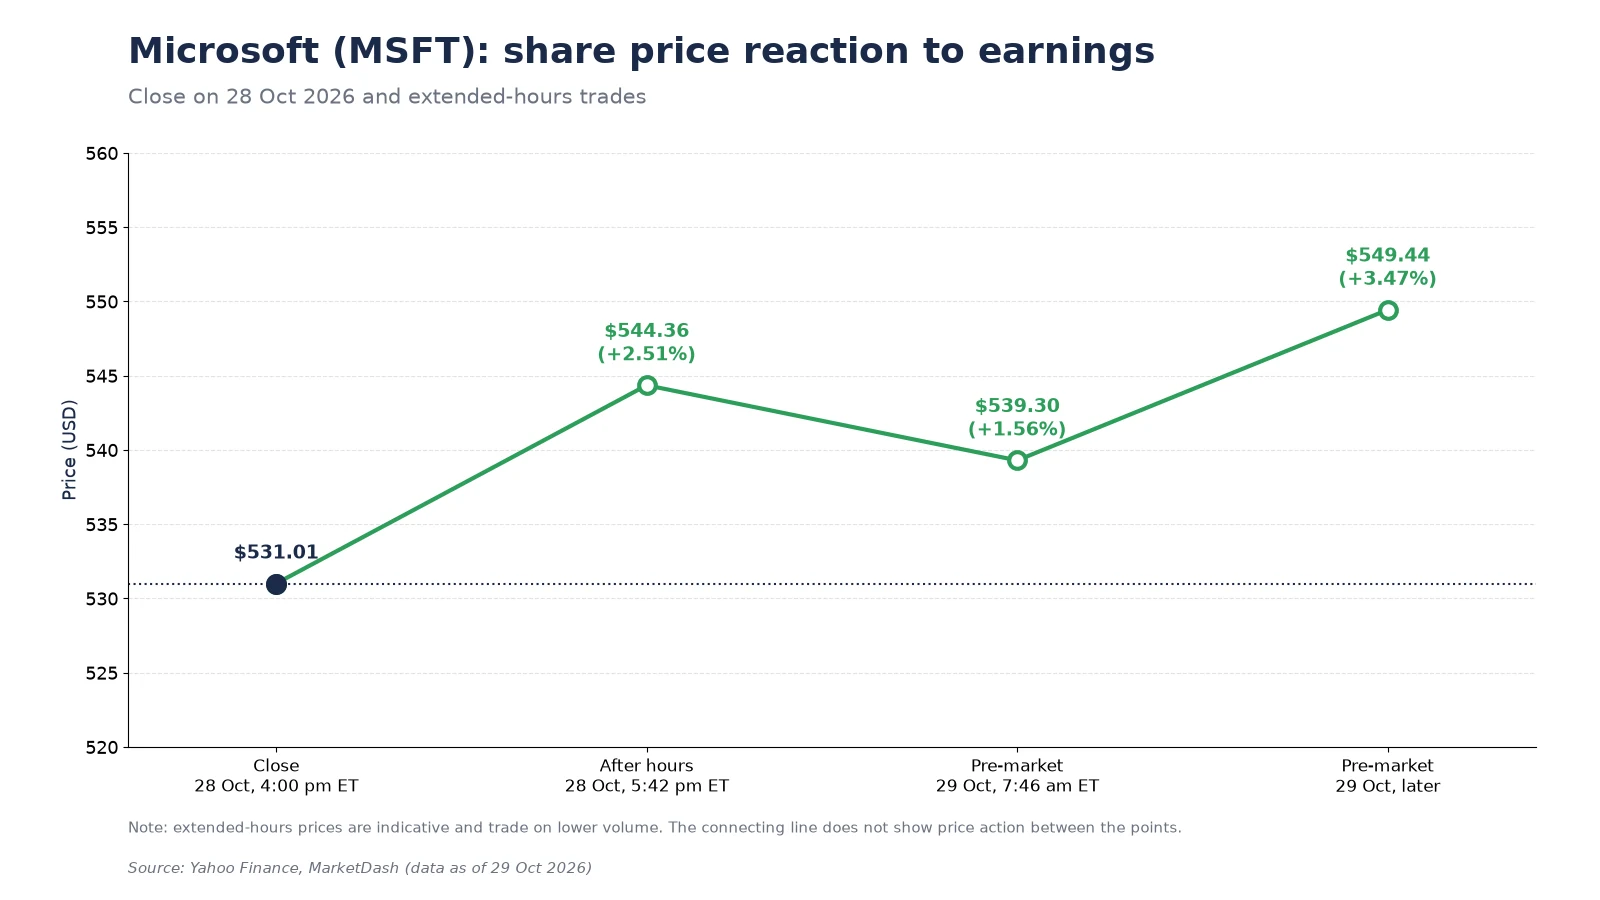
At a close of about $531, analysts estimate the trailing P/E at around 28 and the forward P/E at around 26. The average 12-month analyst price target is about $605 (S&P Global, 57 analysts, 29 October), with a consensus Strong Buy rating. After the report the stock rose about 3.5% in pre-market trading (to $549.44), reflecting a positive reaction to Azure growth and positive FCF.
| Metric | Microsoft (MSFT) |
|---|---|
| Close (28 October) | $531.01 |
| Move after earnings | Up about 3.5% (to ~$549) |
| Trailing P/E | ~28 (analyst estimates) |
| Forward P/E | ~26 (analyst estimates) |
| FCF yield | Higher (FCF is positive) |
| Consensus 12-month target | ~$605 (S&P Global, 29 Oct) |
| Target range | $440-870 (S&P Global) |
| Analyst rating | Strong Buy |
| Upside to consensus target* | ~14% from close |
*Upside is calculated from the closing price. Pre-market moves change the current risk/reward.
Position guidance: for an existing long-term position it makes sense to hold and, if desired, add gradually, since the company remains FCF-positive and converts earnings into cash better than some of its peers. We may trim if Azure growth falls below 40% for two consecutive quarters or if FCF turns negative because capex accelerates. We add further if Azure holds above 45-50% and the company shows improving capacity efficiency despite delayed deliveries. A new position can be built at current levels or on a moderate pullback, while tracking Azure’s delivery against guidance and the pace of capex in the second half of the year. The near-term risk is lower than at Alphabet, but the return on the investment requires patience.
Alphabet vs Microsoft: AI infrastructure, capex and cash flow
Both companies are investing aggressively in AI infrastructure. Alphabet shows stronger percentage growth in Cloud and vertical integration with TPUs, but with heavier pressure on cash flow, rising debt and a slowdown in its core advertising business. Microsoft remains FCF-positive and has a larger enterprise platform, but it also faces physical constraints and rising depreciation. The difference in what each depends on is significant: at Alphabet the advance now also relies on external funding, as long-term debt jumped from $21.6 billion to $125.1 billion in a year; at Microsoft the advance is increasingly funded by the cloud business itself, which makes the company more sensitive to any delay in delivering on its RPO.
The key risk is the same for both: if demand for AI infrastructure slows, or if energy and physical constraints prevent capacity from turning into revenue, capex will earn lower returns and depreciation will weigh more heavily on earnings. Investors should watch not only revenue but also the durability of growth, the pace of depreciation and each company’s ability to convert its backlog and RPO into real FCF. Large commitments are a strength only as long as they are delivered on time; any delay turns them into an obligation without matching revenue. At Alphabet, that would increase the need for debt and new shares. At Microsoft, it would make the higher capex even heavier on margins.
Conclusion
It is easy to hold the initiative on the battlefield when our tanks are fresh and the fuel tanks are full. It is harder to keep it when the machines already bear the scars of hits, depreciation is piling up and fuel is starting to run out. Alphabet and Microsoft are still on the offensive in artificial intelligence, forcing other companies to react to their moves. But the results show that the cost of this initiative is now visible on their balance sheets and in their cash flows.
Energy and physical constraints are no longer just a cost; they limit how fast new machines can be brought into battle. At Alphabet, the tank still runs on fuel from the core business, but that fuel is running low and is now being topped up with debt. At Microsoft, the tank increasingly runs on fuel it produces itself from the cloud business, but that fuel depends on customers honouring their commitments on time.
Whoever turns today’s capex into sustainable revenue and FCF in 2027 will keep up the pace. Whoever fails will find that even the most powerful tanks stop when the fuel runs out and the battle damage becomes too heavy. For investors, the question is not whether these companies are strong - they are. The question is whether they have enough fuel to keep advancing before depreciation and physical constraints start to stop them.
Further reading on Borsite
- Gavin Baker: who invests in the scarcity of artificial intelligence
- The Two Gladiators: Tesla and Meta Q3 2026 earnings
- Hot inflation and expensive AI infrastructure debt
- NVIDIA earnings, August 2026: revenue and cash flow
- The Ronin Among the Samurai: SpaceX Q3 2026 earnings
FAQ: Alphabet and Microsoft Q3 2026 earnings
Alphabet spent more on capex ($51.4 billion) than it generated in operating cash flow, and it also built up TPU system inventory and paid a European Commission fine. Microsoft also raised capex significantly, but its $58 billion in operating cash flow covers the spending, leaving positive FCF of $18.6 billion. The fine at Alphabet is a one-off; the core problem is that capex now exceeds operating cash flow. Microsoft still has a buffer, but doubled cash capex is shrinking it.
Yes, because Search remains the largest and most profitable business. The slowdown to 12% growth reduces Cloud’s ability to fully offset the cost of AI infrastructure, especially if it proves lasting. If growth stays below 10% for two consecutive quarters, that would be a clear signal for a reassessment and would increase the need for debt and new share issuance.
The main risk is that current investment will drive higher depreciation and energy costs in 2027, and if demand for AI infrastructure slows or physical constraints (power, components) limit the conversion of capacity into revenue, returns will be lower than expected. These constraints are already slowing growth, not just adding cost. At Alphabet this adds to the pressure on FCF. At Microsoft it makes the higher capex heavier on margins if Azure results slow.
Microsoft looks more resilient in the short term, because it is FCF-positive, beat analyst expectations on Azure and converts earnings into cash better. Alphabet is the riskier of the two because of negative FCF, rising debt and the slowdown in Search. The difference in what each depends on matters: at Alphabet the weight rests on Search and the advance now also relies on debt and share issuance; at Microsoft the advance is increasingly funded by the cloud business itself and depends on delivering on its RPO.
For Alphabet it is wiser to wait for confirmation that capex is starting to turn into sustainable FCF, or to wait for a correction. For Microsoft a new position can be built gradually at current levels, while tracking Azure’s delivery against guidance and the pace of capex in the second half of the year. In both cases the horizon should be at least 12-24 months. The buy signals fade if Search growth at Alphabet stays below 10%, or Azure growth at Microsoft falls below 40%, for two consecutive quarters. Conversely, if Search at Alphabet returns above 14-15% and Cloud works through its backlog without delays, while Azure at Microsoft holds above 45-50% with improving capacity efficiency, the buy signals strengthen.
Alphabet kept its 2026 capex guidance at $195-205 billion and expects a significant increase in 2027. Microsoft expects more than $50 billion in the current quarter and about $170 billion for calendar 2026, with part of the spending shifting into the second half of its fiscal year because of delayed third-party capacity deliveries.
Microsoft’s RPO is $677 billion, up 73% from a year earlier, with about 30% expected to be recognised as revenue over the next 12 months. Google Cloud’s backlog is $561 billion, with just over 55% expected to be recognised over the next 24 months. Both measure contracted revenue not yet recognised, but their scope differs: RPO covers all of Microsoft’s commercial contracts, while the backlog refers only to Google Cloud. A direct comparison is therefore only indicative.
Disclaimer: This article is for educational and informational purposes only and does not constitute investment advice or a recommendation to buy or sell securities or other financial instruments. All investments carry a risk of capital loss. Markets are volatile and can change sharply under the influence of geopolitical, economic and other factors. Do your own research, consult a licensed financial adviser and consider your personal financial situation, risk tolerance and investment objectives before making any investment decision. The author and the platform accept no liability for losses arising from actions or omissions based on the information in this article. Invest responsibly.
Leave a Reply
You must log in or register to leave a comment.