


Analysis of SpaceX’s Third-Quarter 2026 Report
In short: SpaceX’s AI revenue overtook Starlink for the first time and the profit is real, but capex is outrunning cash flow and, absent new financing, the net cash position falls below the critical threshold as early as the end of 2026.
The key questions are customer concentration, the price per watt and whether Starlink can finance the battle.
The Seven Samurai
The name “Magnificent Seven” on the markets covers Apple, Microsoft, Alphabet, Amazon, Nvidia, Meta and Tesla - the seven companies whose shares have set the direction of the U.S. capital markets in recent years. It is inspired by Akira Kurosawa’s film Seven Samurai, made in 1954. In it, a group of villagers hire seven samurai to protect their village from a band of bandits. Among them is Toshiro Mifune, who plays Kikuchiyo - the most impulsive and unpredictable of the seven. Most of the hired samurai are in fact ronin, and Kikuchiyo is a farmer’s son posing as a samurai who has to prove that he belongs among them. The film is not only about the battle; it is also about the cost of defence, about loyalty, and about the defence of a warrior’s values. In the end, that is all that remains when the fighting is over.

SpaceX is not part of this seven. In the age of the samurai there were also ronin - masterless samurai who had lost their daimyo and wandered without patronage and without a fixed place in the hierarchy. They stood outside the established order, yet they carried the same skills and the same weapons. Alongside seven samurai companies there are now also ronin such as SpaceX, which want to take their starry place among the samurai.
The Ronin
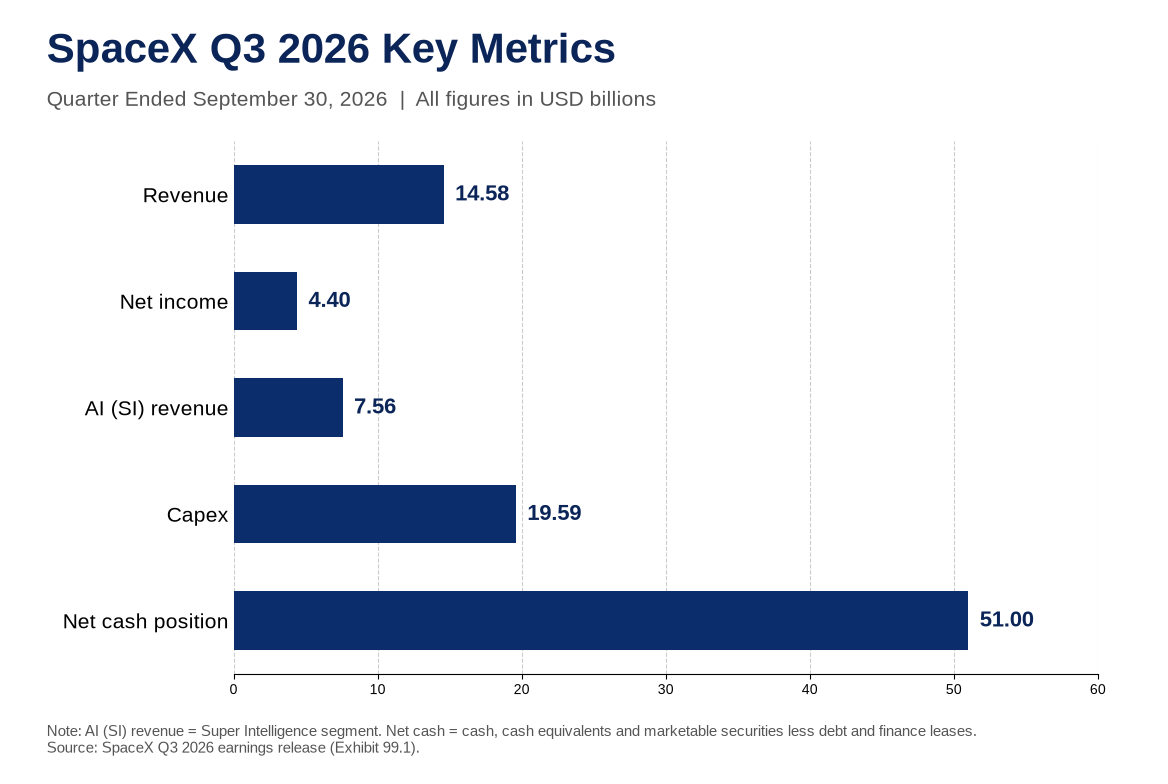
SpaceX published its third-quarter 2026 report on 20 October and showed for the first time that revenue from the rental of computing capacity and related AI services exceeded revenue from Starlink. Total revenue reached $14.58 billion, up 161% year on year and above analysts’ expectations. Net income was $4.4 billion against a loss of $1.1 billion a year earlier. Of this, operating income was $2.79 billion; the rest came from interest and other income and a tax benefit. On the surface the result is strong. When the quality of revenue, the structure of capital expenditure, the temporary nature of the financing and the interaction between customer concentration, power constraints and competitive dynamics are examined, however, it becomes clear that rapid growth depends on the almost continuous execution of aggressive plans for volume and pricing. Any material deviation - particularly the simultaneous failure to deliver both volume and price - would increase negative free cash flow and accelerate the exhaustion of net cash. That is something the market has not yet fully priced in.
Key Figures from the Report
| Indicator | Value | Change |
|---|---|---|
| Total revenue | $14.58 billion | +161% year on year |
| Net income | $4.4 billion | versus a loss of $1.1 billion |
| Super Intelligence (AI) | $7.56 billion | 52% of total revenue |
| Starlink | $5.25 billion | +69% |
| Capex for the quarter | $19.59 billion | of which $16.44 billion to AI |
| Net cash position | approximately $51 billion | cash $89.9 bn / debt $38.8 bn |
Revenue by Segment and Its Quality
Super Intelligence contributed $7.56 billion, or 52% of total revenue, a more than ninefold increase from $813 million a year earlier. The total includes $538 million of advertising; compute and solutions revenue alone was $7.02 billion, still above Starlink. Of this amount, $608 million came from Cursor for the period after the closing of the transaction on 14 August. Even without that portion the AI segment still exceeds Starlink, though the jump is more moderate. In the second quarter one customer accounted for about 19.5% of total revenue, entirely in the AI segment. Names and shares were not disclosed for the third quarter. If concentration has continued and if 15-20% of total revenue remains tied to one or two customers under predominantly short-term contracts, a moderate reduction in volume or price from those customers would lift negative free cash flow by $2-3 billion per quarter and accelerate the exhaustion of cash (about $15.5 billion at the end of 2026 versus $18 billion in the base scenario).
Net income was also supported by about $1 billion from the recovery in the price of Bitcoin and from related parties. The AI segment’s operating profit of $431 million is after one-off stock-based compensation costs related to Cursor. These elements must be separated clearly from recurring revenue: part of the $7.56 billion is one-off or concentrated rather than sustainably recurring.
The Connectivity (Starlink) segment generated $5.25 billion, up 69%, with operating profit of $2.37 billion; $2.13 billion of the revenue came from enterprise and government customers. Subscribers reached 13.6 million (+1.6 million for the quarter). Average monthly revenue per user, however, fell to $69 from $83 a year earlier, although it rose from $66 in the second quarter. Growth has come from volume, not from price. International expansion and cheaper plans are structural. If average monthly revenue stabilises around or below $65-70, the segment’s contribution to free cash flow after covering its own capex and after growth in the subscriber base will be limited.
To extend the cash runway by about one quarter at the current pace of capex, Starlink would need to redirect at least $3-4 billion of operating cash flow per quarter to AI infrastructure after meeting its own needs - well above current levels. If the gap remains large, dependence on the return on AI investment becomes even greater. Here the ronin metaphor becomes concrete: Starlink could be the daimyo that provides patronage and finances the battle, but only if average monthly revenue stabilises and the segment redirects sufficient cash flow after meeting its own needs. If it does not, the ronin remains without a master and must carry the entire burden of capex alone.
The space segment produced about $1.77-1.8 billion and is close to zero on an operating basis for the quarter (a loss of $1.21 billion for the nine months), but acceleration of Starship could add $2-4 billion of capex per quarter and shorten the runway further.
Revenue Distribution by Segment
| Segment | Revenue ($ bn) | Share | Note |
|---|---|---|---|
| Super Intelligence (AI) | 7.56 | 52% | includes $608 m from Cursor |
| Starlink | 5.25 | 36% | ARPU $69 |
| Space activities | 1.77-1.8 | 12% | close to zero operating |
| Total | 14.58 | 100% | +161% year on year |
Capex and Its Sources of Financing
Capital expenditure for the third quarter was $19.59 billion, of which $16.44 billion went to Super Intelligence. For the nine months it reached $48.07 billion. For the fourth quarter management expects $35-40 billion. Financing to date has been distributed as follows:
Equity: the main source is net proceeds from the initial public offering - about $85.7 billion for the nine months. This covered most of the gap between operating cash flow ($13.1 billion) and capex ($48.1 billion). This is a one-off source.
Debt: net new financing of about $12 billion for the nine months. Total debt and finance leases at the end of September were $38.8 billion, of which about one-third is to related parties. Of this, $2.7 billion is current and $36.1 billion long-term; the maturity schedule is not given in the release. The terms of these debts have not been disclosed; if relations deteriorate they could prove more expensive or less flexible and add pressure on cash balances.
Leasing: included in the “debt and finance leases” line; not separately broken out as a primary instrument for AI capacity.
Deferred payments and prepayments: the increase in deferred revenue contributed about $4.9 billion to operating cash flow for the nine months. This is not capital but temporary financing from customers.
Own cash: at the end of the period cash and short-term investments were about $89.9 billion, giving a net cash position of approximately $51 billion after deducting debt. This position is real at present, but it is primarily the result of the initial public offering and of prepayments, not of generated free cash flow.
Sources of Financing for Capex (Nine Months)
| Source | Approximate Amount | Nature |
|---|---|---|
| IPO proceeds | about $85.7 billion | one-off |
| Net new debt financing | about $12 billion | partly related parties |
| Contribution of deferred revenue | about $4.9 billion | temporary |
| Operating cash flow | $13.1 billion | ongoing |
| Capex for the period | $48.07 billion | - |
| Net cash position at end | about $51 billion | buffer |
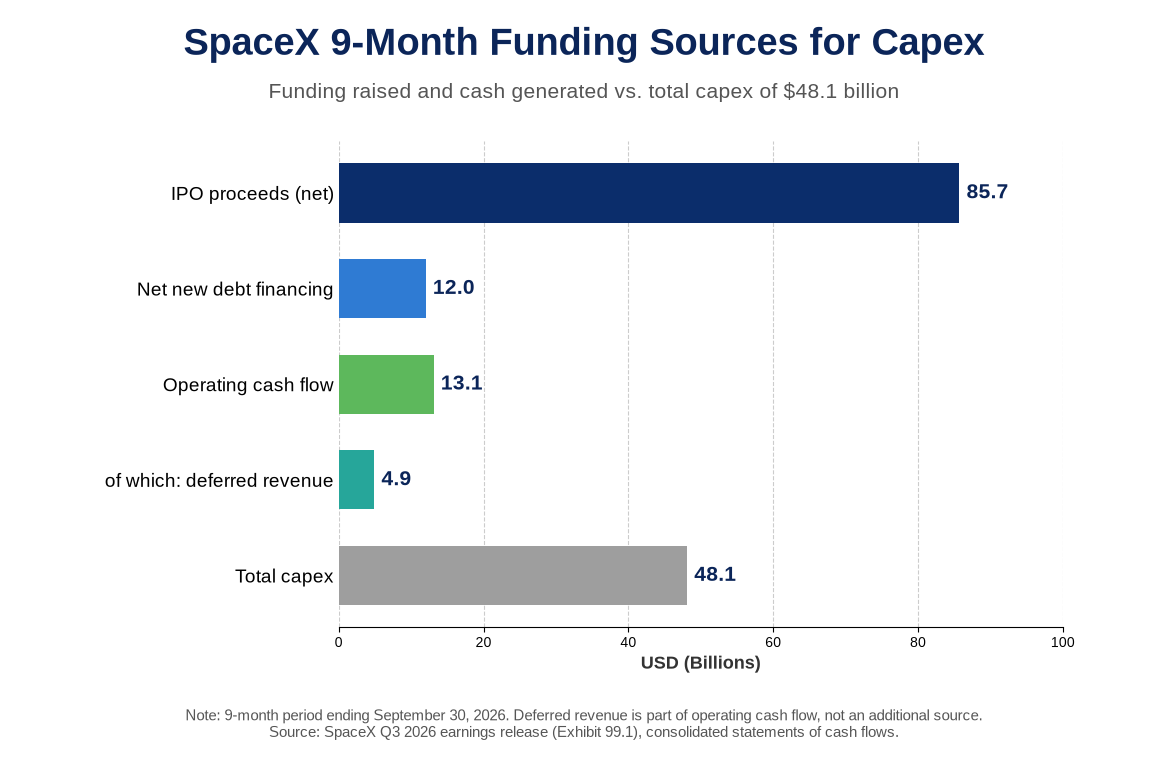
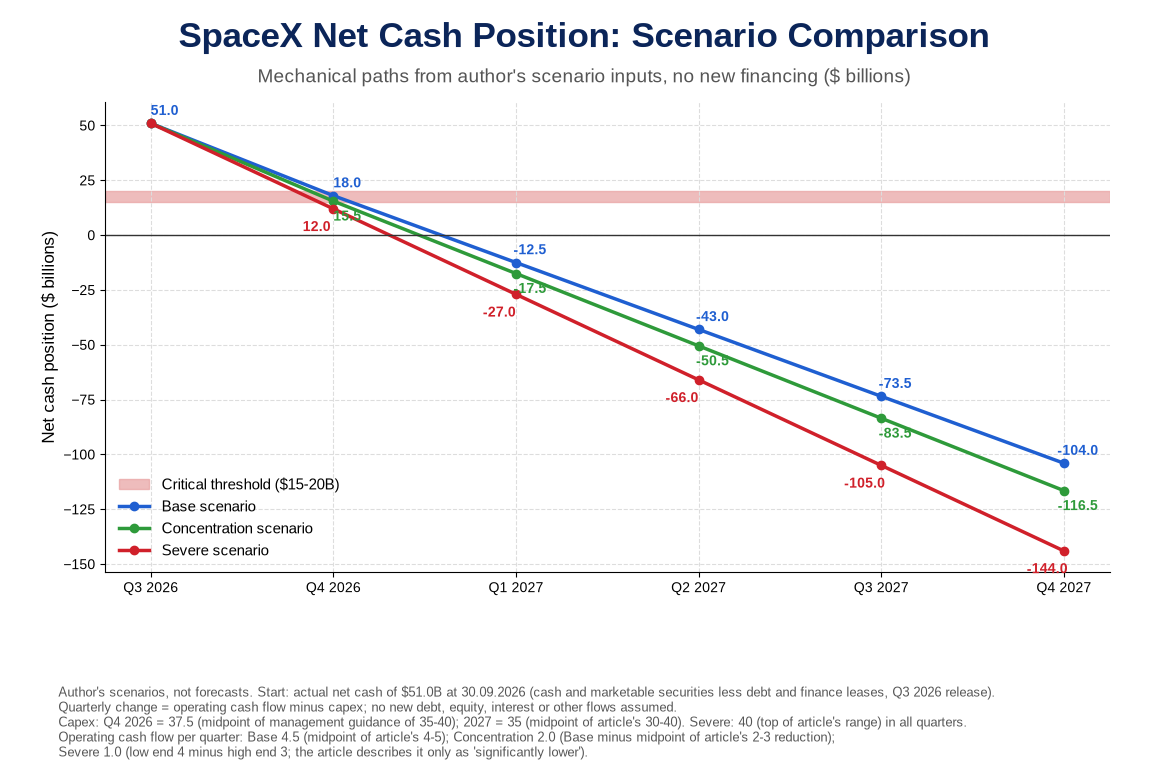
Free cash flow for the nine months is negative (about -$35 billion). With capex of $35-40 billion in the next quarter alone and plans for substantially larger capacity in 2027, cash will be exhausted within a few quarters if the current operating cash flow is maintained. If operating cash flow remains around $4-5 billion per quarter and capex stays around $30-40 billion, the net cash position falls below the critical threshold (below $15-20 billion) as early as the end of 2026 (about $18 billion in the fourth quarter) and, absent new financing, turns negative in the first quarter of 2027. Even if operating cash flow rises to $8-10 billion per quarter, the runway to this threshold is extended by only about one quarter. For comparison, operating cash flow in the third quarter alone was about $9.6 billion, although part of that quarter’s margin came from one-off benefits. The scenarios include no new financing; the company, however, has access to debt markets ($51.8 billion of new debt over the nine months) and describes its balance sheet as investment grade, so the question is the cost of financing rather than its availability.
Sensitivity of the Net Cash Position
| Scenario | Operating cash flow | Capex | Time to critical threshold |
|---|---|---|---|
| Base | $4-5 billion | $30-40 billion | Q4 2026 |
| With 15-20% concentration | $2-3 billion less | $30-40 billion | same quarter |
| Accelerated flow | $8-10 billion | $30-40 billion | extended by about one quarter |
| Most severe | significantly lower | high | fastest exhaustion |
Management Expectations
Management expects revenue of $33-37 billion in the first quarter of 2027 and computing capacity of nearly 2 GW at the end of October, 2.5-3 GW by year-end, and confidence in a further roughly 10 GW in 2027. Rental prices are slightly above the upper end of the previous range of $30-50 per watt, with payback of the investment in less than a year. This claim has not been proven at large volume. The first-quarter 2027 guidance also implies more than doubling revenue from $14.58 billion in the third quarter within two quarters. The main risk is the most severe realistic scenario: capacity expands more slowly than stated because of power and cooling constraints, while prices per watt fall below $40 at the same time on the available volume, because hyperscalers are building their own capacity and negotiating more aggressively.
In that case payback lengthens significantly, negative free cash flow increases, and cash is exhausted faster than in the base scenario. The wide range for annual recurring revenue of $500 billion to $1 trillion by the end of 2027 remains a direction, not a budget. Management’s nearer target is $100 billion of annual recurring revenue by the end of 2026, based on December. Musk’s track record of forecasts requires scepticism toward his considerable optimism. The creation of special committees to discuss a merger with Tesla has been confirmed, but there are no terms and the voting threshold for Tesla shareholders is high. Potential conflicts of interest arising from Musk’s dual role, the effect on control and on the allocation of capital expenditure between the two companies, and regulatory hurdles remain unassessed.
Red Flags
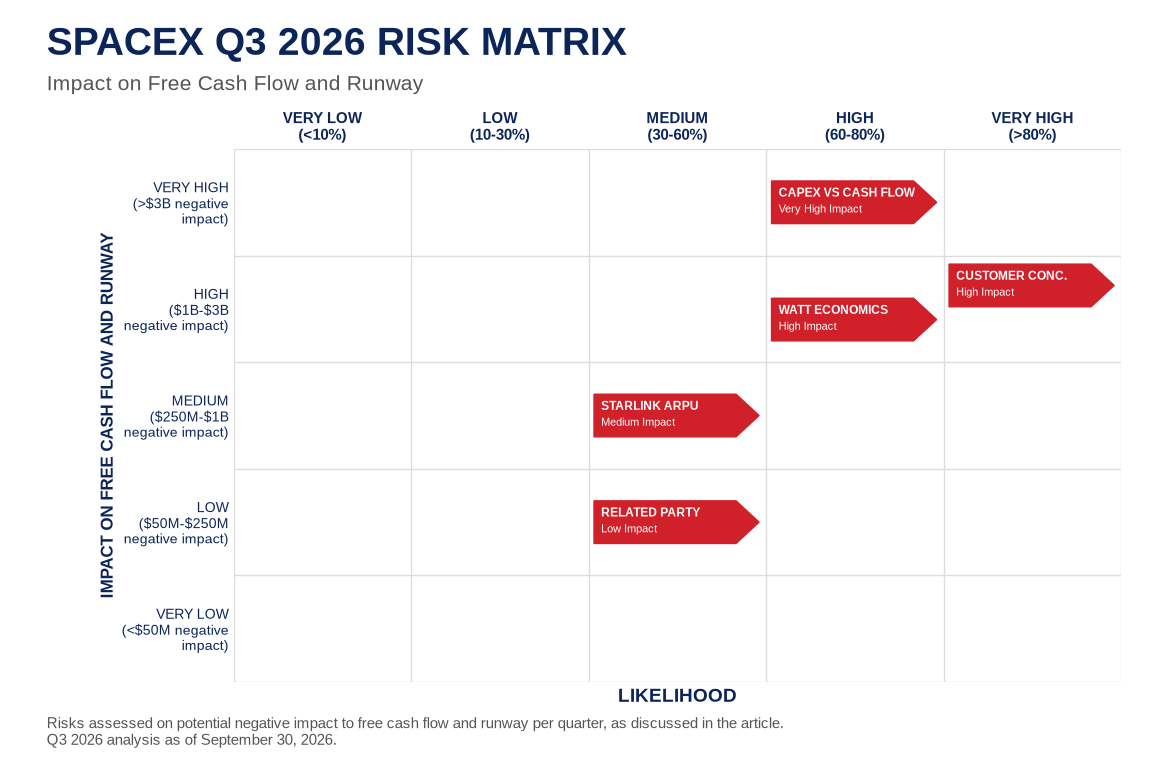
The primary red flag is the quality and concentration of AI revenue. A significant part of the jump may be tied to one or several large customers under short-term contracts, to a partial quarter of Cursor, and to one-off items. The scenario in which 15-20% of revenue is concentrated and short-term is realistic and would lift negative free cash flow by $2-3 billion per quarter, accelerating the exhaustion of cash (about $15.5 billion at the end of 2026 versus $18 billion in the base scenario).
The second flag is the most severe realistic scenario for the return on investment per watt (the economics of each installed watt of capacity): capacity expands more slowly because of power and cooling, while prices fall below $40 per watt at the same time. This lengthens the payback period and accelerates the exhaustion of cash.
The third flag is the year-on-year decline in average monthly revenue at Starlink, despite the recovery from the second quarter. Volume is growing, but monetisation per user is contracting year on year, and the current contribution is far from the $3-4 billion per quarter threshold needed to extend the runway.
The fourth is the relationship between capex and generated cash flow. The net cash position of about $51 billion is strong now, but it is the result of one-off capital raising and of prepayments. At the current pace the position falls below the critical threshold as early as the end of 2026, and an acceleration of operating cash flow to $8-10 billion per quarter would delay this by only about one quarter.
The fifth is related-party dependencies - part of the debt is to related parties on undisclosed terms, which could add pressure if relations deteriorate, while the potential merger with Tesla adds complexity to control and to the allocation of capital expenditure.
The sixth is the high valuation relative to current earnings: the market is pricing future scale, rapid payback and the merger option, which makes the price sensitive to any combination of delay in capacity timelines and disappointment on the merger.
The seventh is the potential additional capital needs from acceleration of Starship, which could shorten the runway further.
Summary of Red Flags
| Flag | Description | Potential Effect |
|---|---|---|
| Concentration of AI revenue | 15-20% possibly concentrated and short-term | +$2-3 bn negative FCF; faster exhaustion of cash |
| Economics of the watt | slow expansion + prices below $40 | longer payback; faster exhaustion |
| Decline in Starlink ARPU | year-on-year decline to $69 | limited contribution; lower chance of being the daimyo |
| Capex versus cash flow | deeply negative FCF | exhaustion of the buffer in Q1 2027 |
| Related-party dependencies | debt to related parties + merger option | additional pressure and complexity in valuation |
Opportunities
The primary opportunity lies in the scale of AI infrastructure if the return on investment per watt is confirmed at large volume and if power constraints do not halt expansion. If prices remain above $50 per watt, if payback truly occurs in less than a year, and if capacity expands toward 10+ GW in 2027, the segment could generate significant free cash flow in the medium term and extend the cash runway.
The second is the profitability of Starlink. The segment already delivers stable operating profit; if average monthly revenue stabilises and if new markets do not require excessive discounts, it could approach the $3-4 billion per quarter threshold after covering its own capex and become the daimyo that provides patronage for the AI battle.
The third is the potential integration with Tesla. If the committees reach acceptable terms that do not dilute control excessively and do not create unacceptable conflicts, it could combine computing capacity, chips, robotics and orbital data centres under single control.
The fourth is the strong net cash position at present, which gives time to execute plans without immediate resort to expensive debt. This opportunity, however, is temporary and depends on the pace of capex and on the absence of simultaneous failure on volume and price.
SpaceX (SPCX) Key Ratios
| Indicator | Value | Basis |
|---|---|---|
| Share price | $162.18 | Nasdaq, 21 October 2026, 10:25 a.m. EDT |
| Shares outstanding | 13.58 billion | Class A and Class B at 30 September 2026 |
| Market capitalisation | about $2,202 billion | price x shares |
| Net cash position | $51.0 billion | 30 September 2026 |
| Enterprise value (EV) | about $2,151 billion | market cap minus net cash |
| Trailing 12-month revenue | $32.04 billion | Q4 2025 + first nine months of 2026 |
| P/S (trailing 12 months) | about 69x | |
| EV/Sales (trailing 12 months) | about 67x | |
| EV/Sales (Q3 x 4) | about 37x | Q3 revenue annualised |
| EV/Sales on Q1 2027 guidance x 4 | about 15-16x | based on management guidance |
| P/E (trailing 12 months) | - | net loss of $2.58 billion |
| P/E (Q3 x 4) | about 125x | earnings include one-off items |
| Gross margin Q3 | 62.4% | |
| Operating margin Q3 | 19.1% | |
| Net margin Q3 | 30.2% | above operating margin due to non-operating income |
| Free cash flow (nine months) | about -$35.0 billion | operating cash flow minus capex |
| Free cash flow yield | about -1.6% | nine months, relative to market cap |
| Capex / revenue | 134% for Q3; 177% for nine months | |
| Debt / equity | 0.22 | debt and finance leases $38.8 billion / equity $176.8 billion |
| ROE (Q3 x 4) | about 10% | equity increased by the IPO |
At about 67 times trailing revenue and about 125 times annualised third-quarter earnings, the market is already pricing SpaceX not as a ronin but as a samurai that has won the battle. Even if the first-quarter 2027 guidance is met, EV/Sales remains at about 15-16 times, while free cash flow is negative and capex exceeds revenue. The profit is real, but part of it comes from non-operating items, and the valuation depends on whether the return per watt and customer concentration move in the direction management promises. For an investor who relies on fundamentals and holds positions for at least several months, these levels offer no margin of safety for a new purchase. My stance is therefore “hold / wait”: I would not sell an existing position, because operating cash flow is growing and the balance sheet allows financing, but I would not buy at these levels before the next two quarters show whether the ronin has found its daimyo. A better entry point would be a lower valuation or confirmation that cash flow is starting to cover capex.
From Ronin to Samurai
SpaceX has moved into a regime in which the AI business is the primary source of revenue and capex is the primary source of risk. Profit is real and exceeds expectations, liquidity is strong thanks to the initial public offering, but the quality of AI revenue contains concentration and one-off elements, Starlink’s average monthly revenue is contracting year on year, and free cash flow remains deeply negative. The return on investment per watt has not been proven at large volume, power constraints can halt expansion, and net cash is being exhausted quickly at the stated pace of investment - even more quickly in the event of simultaneous failure on volume and price or concentration of 15-20%.
The next two quarters will show whether the return materialises at the stated prices and timelines, whether concentration toward individual customers dissipates, and whether the discussion of a merger with Tesla moves from committees to a concrete proposal. Until then the valuation remains dependent on faith in the continuous execution of aggressive plans for capacity and pricing, rather than on the business’s current ability to fund itself. Any material deviation from these plans - particularly the simultaneous one - would be a disappointment that the market has not yet fully priced in.
A ronin does not become a samurai merely by carrying the same weapon. He becomes a samurai when he finds a master who accepts him and when the battle he fights turns out to be the one the village needs. SpaceX carries the weapons of AI infrastructure and of Starlink, but it is still wandering without a fixed place among the seven. The next two quarters will show whether Starlink proves to be the daimyo that provides patronage through sustainable cash flow, or whether the ronin will have to prove on its own that the battle for computing capacity is worth the cost. If it does not, it will remain a ronin - skilled, armed, and still outside the order.
Frequently Asked Questions
Which companies make up the Magnificent Seven and why is SpaceX not among them?
Apple, Microsoft, Alphabet, Amazon, Nvidia, Meta and Tesla. SpaceX is not among them because the group was defined historically, SpaceX has been public only since June 2026, and it has not yet demonstrated sustainable free cash flow that would place it in the same order as the established companies.
What would confirmation of 15-20% concentration in AI revenue mean?
A moderate reduction in volume or price from those customers would lift negative free cash flow by $2-3 billion per quarter and accelerate the exhaustion of cash (about $15.5 billion at the end of 2026 versus $18 billion in the base scenario).
Can Starlink be the daimyo for the AI investments?
Only if average monthly revenue stabilises and the segment redirects at least $3-4 billion of operating cash flow per quarter after meeting its own needs. The current contribution is far from that threshold.
What is the most severe realistic scenario for the economics of the watt?
Capacity expands more slowly because of power and cooling constraints, while prices fall below $40 per watt at the same time. In that case the buffer is exhausted fastest.
What must happen for SpaceX to move from ronin to samurai?
It must demonstrate sustainable free cash flow through confirmed return on investment per watt at large volume and through the dissipation of customer concentration, or it must receive patronage from Starlink as a stable source of financing.
Important notice
This article is for information and education only. It is not financial advice, an investment recommendation or professional advice of any kind. The views expressed are the author’s personal opinions and are not recommendations to buy, sell or hold securities, assets or investments. Investing involves substantial risk, including the possible loss of all capital. Past performance is not a guarantee of future results. Each reader should conduct independent research, consult a qualified financial adviser and weigh financial circumstances, risk tolerance and investment objectives before taking any decision. The author and borsite.net accept no liability for any loss arising from the use of the information in this article.
Leave a Reply
Трябва да влезете или да се регистрирате, за да публикувате коментар.