One company is building AI capacity with borrowed money; the other is paying for its growth out of its own cash. Their November results show who carries the weight of the cycle, and what that means for the size of a position.
Market data as of the US close on November 13, 2026.
In Roman mythology Janus is the god with two faces looking in opposite directions. One looks back at what has been; the other looks ahead to what is coming. The Romans placed him at thresholds and gates, believing that every beginning carries both the past and the future. The two faces are not a contradiction but a single whole that simply cannot be seen at once. The same duality runs through today’s cycle in artificial intelligence infrastructure. One face belongs to the operator building capacity with heavy debt and high capital expenditure. The other belongs to the equipment supplier that funds its growth from its own resources and returns capital to shareholders. CoreWeave and Applied Materials stand on exactly these two sides. Applied carries the memory of past semiconductor cycles and the discipline they taught; CoreWeave is betting almost everything on the future, on contracts that have yet to turn into revenue.
The two companies at a glance
| Metric | CoreWeave | Applied Materials |
|---|---|---|
| Total debt | ~$46.9bn ($41.6bn recourse) | ~$6.5bn (net cash position) |
| Shareholders’ equity | $4.0bn | $26.1bn |
| Capital expenditure (annual) | $37-39bn (2026 guidance) | ~$2.7bn (FY2026) |
| Free cash flow | about -$17.9bn (first nine months of 2026) | $6.2bn (FY2026) |
| Interest as % of revenue | 22-27% | ~0.8% |
| Interest vs. adjusted operating income | 2.2x (Q3 2026) | under 0.03x (FY2026) |
| Valuation | enterprise value ~$90bn, about 7-7.5x exit-rate EBITDA | ~19-20x expected FY2027 earnings |
| Share price (November 13, 2026) | $53.13 | $370.50 |
Source: CoreWeave, Q3 2026 results and Form 10-Q; Applied Materials, Q4 FY2026 results; prices and valuation: Finviz, Yahoo Finance. Data as of November 13, 2026.
CoreWeave: growth paid for with debt
Third-quarter 2026 revenue reached $3.661bn, up 168% year on year (results). Adjusted operating income was $379m and adjusted earnings before interest, taxes, depreciation and amortization (EBITDA) came to $2.256bn, a margin of about 62%. The net loss, however, widened to $709m, driven mainly by interest expense of $846m. For the full year 2026 the company guided revenue to $13.0-13.3bn and year-end annualized revenue to $20-21bn (the last month of the quarter multiplied by 12). Its backlog of contracted future revenue reached $132.5bn. Active power exceeded 1.7 gigawatts, with 4.6 gigawatts contracted. The shares trade at about $53, giving a market capitalization of about $29bn, some 62% below the 52-week high of $138.25 (Finviz). Short interest stands at about 21% of the float (as of October 30, 2026, ChartExchange).
Capital expenditure for the year is expected at $37-39bn. Funding comes mainly from delayed-draw term loans tied to specific customer contracts, and from roughly $9bn of customer prepayments expected over the next three months. Recourse debt (debt for which the whole company is liable, not just a particular subsidiary) is about $41.6bn, and total debt about $46.9bn (10-Q, Note 10). Part of the borrowing is floating-rate (the revolving credit facility and some term loans priced over SOFR), but the company holds interest-rate swaps with a notional value of about $6.8bn and is required to hedge at least 95% of floating-rate borrowings under its new credit facilities. Another part carries high fixed rates (coupons of 8.5% to 9.75%, while market yields on the outstanding bonds have reached 14-16%, CNBC). Interest already absorbs between 22% and 27% of revenue. In the third quarter it was 2.2 times adjusted operating income and about 37% of adjusted EBITDA. Maturities total $10.97bn in 2027 and $5.48bn in 2028. On top of the debt, the company has $18.7bn of operating lease liabilities and a further $47.4bn of future payments under leases that have not yet commenced. Shareholders’ equity is $4.0bn against liabilities of $87.5bn.
Nvidia is at once the supplier of its graphics processors (GPUs), a shareholder (in January 2026 it bought another $2bn of stock at $87.20 a share, 10-Q) and a contracted buyer of unsold capacity worth about $6.3bn through April 2032 (8-K). This circular dependence concentrates both residual-value risk on the equipment and demand risk on a single counterparty.
Customer concentration has not gone away, but it is easing. In the third quarter of 2026 two customers accounted for about 30% and 24% of revenue; in the second quarter three customers accounted for about 36%, 26% and 10% (10-Q). The company cautions that the letters used to designate customers may refer to different companies in different periods. The largest customers (historically Microsoft, with about 67% of 2025 revenue, 10-K, plus Meta and OpenAI) remain dominant and are building capacity of their own. On November 6 CNBC and Bloomberg reported that Microsoft is cutting the number of its neocloud partners and prioritizing its own data centers, and that some of its GPU contracts have been pushed into the first half of 2027 (CNBC). As GPU supply normalizes, outside demand could fall.
Management has an answer to these risks, and it deserves a hearing. At current yields CoreWeave does not plan to issue new unsecured debt at the parent level before the end of 2027 and expects to raise less than $5bn there. It has about $5bn of undrawn term loans, and according to Bloomberg it is preparing a new investment-grade secured loan of at least $4bn, backed by its Meta contracts, at a yield of about 7-7.5%, roughly half the yield on its high-yield bonds (transcript, Quartz). In addition, more than 130,000 GPUs come off contract in 2027 and about 170,000 in 2028, and the company says they are being re-signed at prices above the original ones, with renewals adding about $4bn of annualized revenue in 2027. These are management claims, but they speak directly to the residual-value fear and should be tracked quarter by quarter.
CoreWeave debt structure as of September 30, 2026
| Type of debt | Amount | Rate | Note |
|---|---|---|---|
| Delayed-draw term loans | ~$17.6bn | effective 7-15% | $13.1bn recourse and $4.6bn non-recourse; tied to customer contracts |
| Convertible senior notes | ~$10.8bn | coupons 1.75-2.875% | conversion price about $98-120 on the 2026 issues |
| High-yield senior notes | ~$10.0bn | coupons 8.5-9.75% (market yields 14-16%) | includes EUR 2bn |
| Equipment and software vendor (OEM) financing | ~$7.7bn | effective about 9-10% | $6.9bn recourse |
| Revolving credit facility | ~$1.2bn | floating over SOFR (effective ~7%) | |
| Magnetar loan | ~$0.2bn | effective ~12% | |
| Total | ~$47.5bn principal | $46.9bn net of discounts and issuance costs |
Source: CoreWeave, Form 10-Q as of September 30, 2026, Note 10 (Debt).
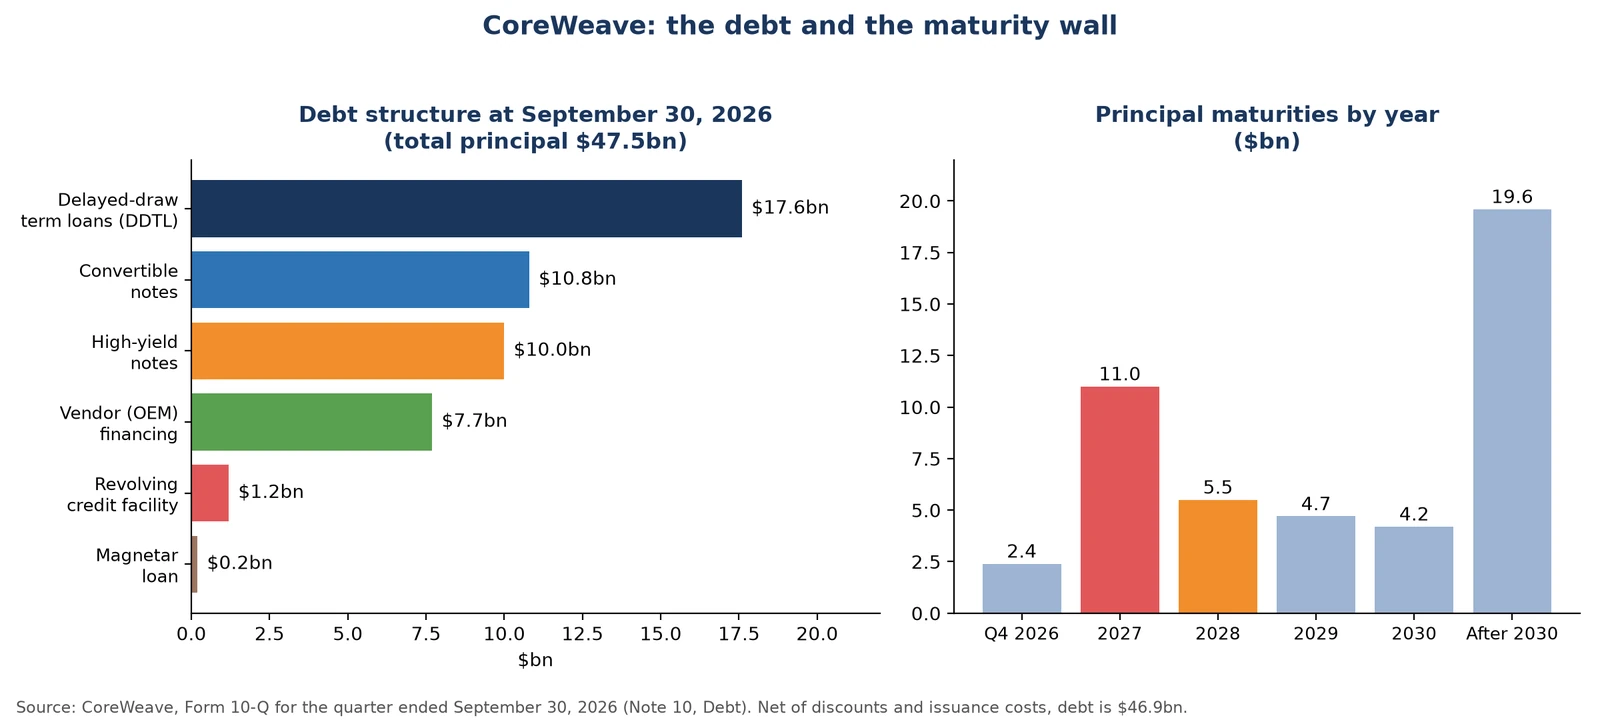
Sensitivity to rates and spreads depends on how quickly the debt reprices. About $23bn carries a fixed coupon and part of the floating-rate debt is swapped, so by our rough estimate unhedged floating-rate debt is around $10bn. The immediate effect of a 100 basis point widening is about $0.1bn a year. The real channel is refinancing and new borrowing: maturities through the end of 2028 total about $19bn, and even if the company limits itself to contracted commitments, 2027 capital expenditure will be in line with the $37-39bn of 2026 (transcript). If the existing debt fully repriced, additional annual interest would reach about $0.4-0.5bn at 100 basis points, about $0.8-1.0bn at 200 and about $1.2-1.5bn at 300 basis points. If at the same time the conversion of contracted power into active power fell 20% behind schedule, the cash shortfall would move from moderate to significant and finally to critical, with a risk of pressure on loan covenants.
Sensitivity of CoreWeave’s annual interest expense
| Widening in rates and spreads | Immediate (unhedged floating debt ~$10bn) | On refinancing maturities through end-2028 (~$19bn) | On full repricing of the debt (~$46.9bn) |
|---|---|---|---|
| +100 basis points | ~$0.1bn | ~$0.2bn | ~$0.4-0.5bn |
| +200 basis points | ~$0.2bn | ~$0.4bn | ~$0.8-1.0bn |
| +300 basis points | ~$0.3bn | ~$0.6bn | ~$1.2-1.5bn |
Source: author’s calculations based on the Form 10-Q as of September 30, 2026 (maturities, swaps, fixed coupons). The size of unhedged floating-rate debt is a rough estimate.
If customers slow their own capital spending (slower acceptance of capacity and smaller prepayments), revenue recognition lags while interest and capex commitments continue. The residual value of GPUs deteriorates at lower utilization, which makes new capital more expensive.
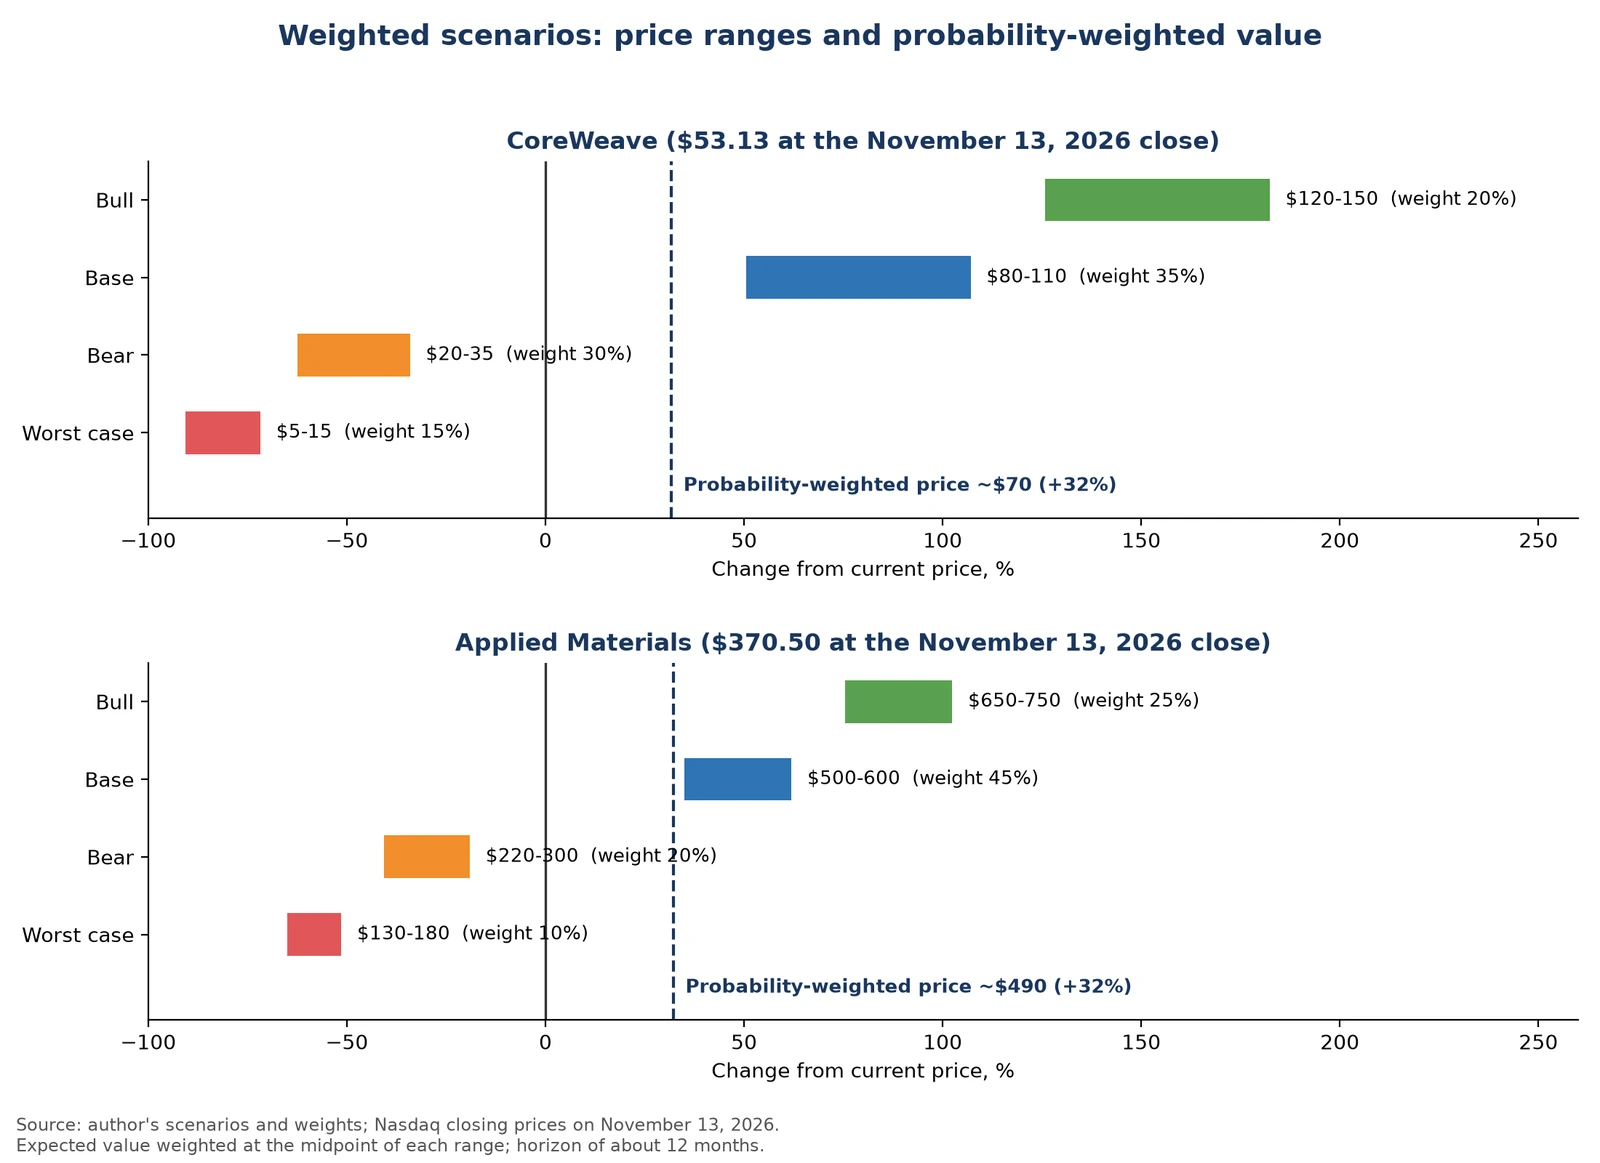
The weighted scenarios look like this. The horizon is about 12 months. In the base case, weighted at 35%, power delivery stays on schedule and spreads remain stable, so annualized revenue reaches about $20bn by year-end, the net loss narrows gradually and the share price moves toward $80-110. That implies a market capitalization of about $44-61bn without further dilution and an enterprise value of about $105-120bn, against about $90bn today. The average analyst price target is about $114-120. In the bull case, weighted at 20%, conversion accelerates, the customer base diversifies and the credit profile improves, pointing to $120-150. In the bear case, weighted at 30%, capacity lags and spreads widen by 200 basis points, so funding comes under strain, dilution follows (the company already has an at-the-market program to sell up to 35m new shares, about 6% of the share count) and the price falls toward $20-35. In the worst case, weighted at 15%, a 300 basis point widening in spreads, a delay of more than 30% in acceptance, a residual-value shock and customer pullback combine, and access to funding dries up. The convertible notes (the 2026 issues have conversion prices of about $98-120) do not convert but remain as $10.8bn of debt ranking ahead of shareholders, leading to distressed share issuance or a debt-for-equity swap in a restructuring, and the value of the equity falls toward $5-15 or is almost wiped out.
CoreWeave scenarios: assumptions and price ranges
| Scenario | Weight | Key assumptions | Indicative price |
|---|---|---|---|
| Base | 35% | power delivered on schedule, stable spreads, annualized revenue ~$20bn, market cap ~$44-61bn, enterprise value ~$105-120bn | $80-110 |
| Bull | 20% | faster conversion of capacity, more diversified customers, stronger credit profile | $120-150 |
| Bear | 30% | capacity lags, spreads widen 200 basis points, dilution (up to 35m new shares) | $20-35 |
| Worst case | 15% | spreads +300 basis points, acceptance more than 30% behind, residual-value shock, customer pullback, restructuring | $5-15 |
| Reference: average analyst price target | ~$114-120 |
Source: author’s scenarios and weights; analyst target from public consensus data; horizon about 12 months.
The sequence of events matters: even a partial recovery after dilution reduces the upside for existing shareholders. That is why position size here is set by the loss budget, not by expected return. With a 1.5% position and a 90% loss in the worst case, the portfolio loses about 1.35%. A position below 1-2% with capped risk is therefore essential.
Applied Materials: profitability that funds itself
Revenue for the fiscal fourth quarter of 2026 reached $10.41bn, up 53% year on year (results). Non-GAAP earnings per share were $4.16. For the full fiscal year revenue was $34.45bn and non-GAAP EPS $12.89. Guidance for the next quarter is $11.1bn, plus or minus $0.5bn; management says revenue would have been slightly higher without supply constraints and expects the market for wafer fabrication equipment to grow by more than 30% in 2027 (Yahoo Finance). The shares trade at about $370.50, roughly 50% below the peak of $739.67 on June 30, when the forward price/earnings ratio was about 49 times (TIKR). Capital expenditure is about $2.7bn a year and free cash flow $6.2bn. Interest expense is about $274m a year, or about 0.8% of revenue. Debt is about $6.5bn, but cash and short-term investments total $9.3bn, and $14.1bn including long-term investments, so the company holds a net cash position. During the year it returned $4.75bn to shareholders, and it expects to distribute 80-100% of free cash flow. The balance sheet is strong and growth is self-funded.
China’s share of revenue fell to 25% in the fourth quarter and 27% for fiscal 2026 as a whole, from 37% in fiscal 2024 (FY2024 10-K) and as much as 44% on a quarterly basis in late 2023. The chief financial officer expects China to account for less than 25% of shipments in 2027 and says Applied is gaining share there, mainly at 28nm (Investing.com). Export restrictions, however, remain structural: during the year the company paid $253m under a settlement with the US Bureau of Industry and Security over export control violations (results), and the restrictions leave part of the Chinese market open only to competitors outside the United States. When the chip equipment market turns down, multiples have historically compressed sharply: companies in the sector have traded at 10-14 times forward earnings in previous corrections (for example 2018-2019 and 2022), against about 19-20 times now and a five-year average of about 21 times (TIKR). Plans to double production carry execution risk if demand slows.
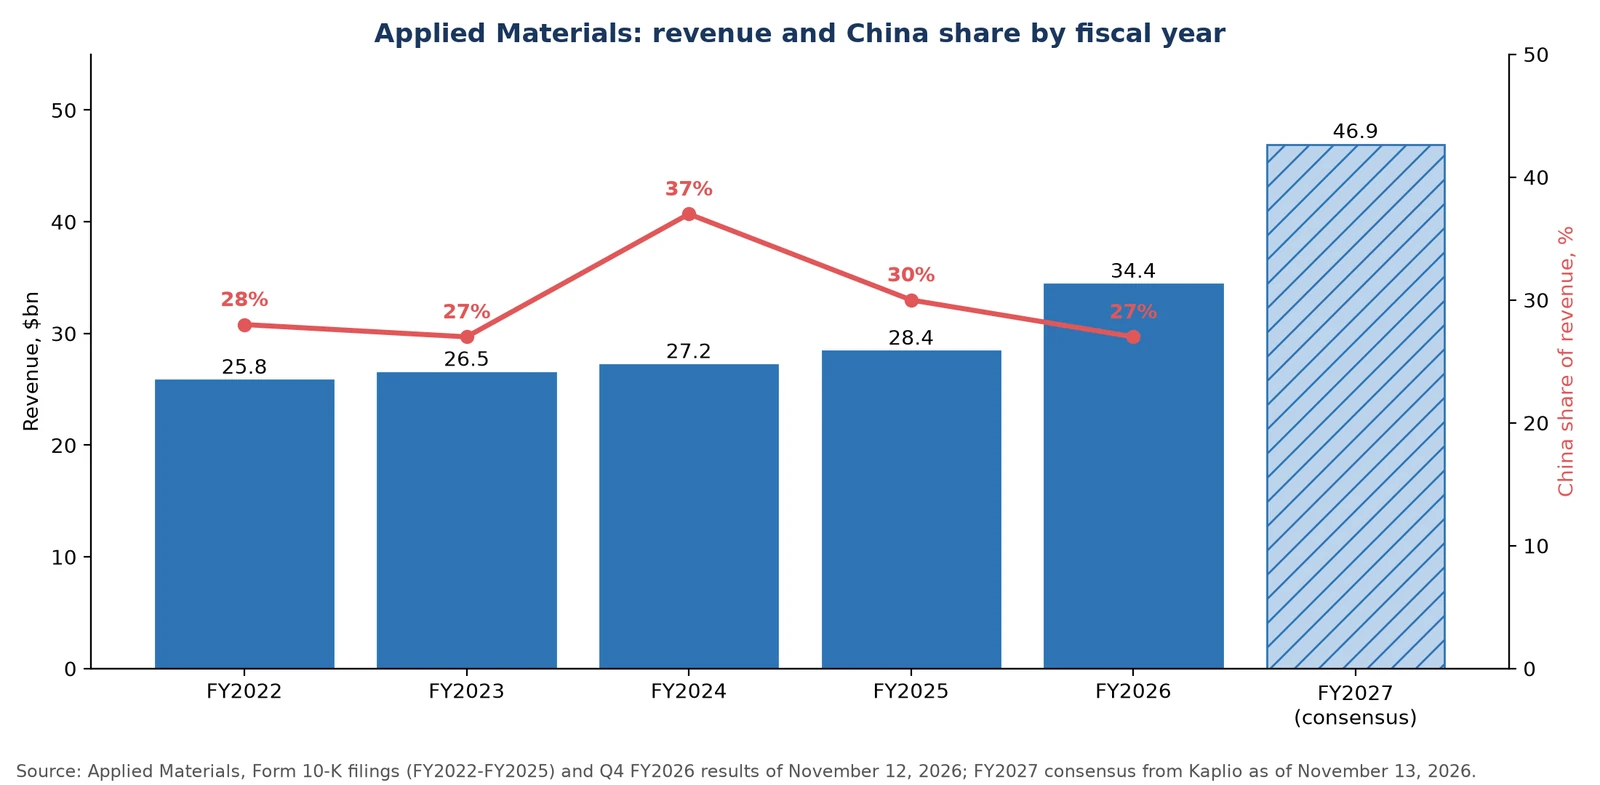
The weighted scenarios for Applied Materials are as follows. Consensus EPS is about $19.1 for fiscal 2027 and about $24.5 for fiscal 2028 (Yahoo Finance), with 2027 revenue of about $46.9bn (Kaplio). In the base case, weighted at 45%, AI-related equipment demand continues and China stabilizes at current levels, so the price moves toward $500-600, or about 20-24 times expected fiscal 2028 earnings. In the bull case, weighted at 25%, demand is stronger and services expand, EPS reaches about $27-30 and at about 24-25 times the price heads toward $650-750. In the bear case, weighted at 20%, AI capital spending slows, revenue falls 15-25% short of 2027 expectations and returns to $35-40bn, EPS drops toward $13-16, the multiple contracts to 17-19 times and the price falls toward $220-300. In the worst case, weighted at 10%, the capex slowdown combines with a further contraction of the Chinese market, revenue falls 25-35%, EPS drops toward $11-13, the multiple contracts to 12-14 times and the price falls toward $130-180. That is a decline of 51-65%, comparable to the drop of about 55% in 2022 (AssetsAnalyzer) and the roughly 50% fall from the 2026 peak. On depressed earnings, multiples rarely fall to the bottom of the historical range, which is why they are not compressed to 10 times here. The balance sheet and free cash flow limit a deeper decline, and restructuring risk is practically nil.
Applied Materials scenarios: earnings per share and multiples
| Scenario | Weight | EPS | Price/earnings | Indicative price |
|---|---|---|---|---|
| FY2027 consensus (revenue ~$46.9bn) | ~$19.1 | ~19-20x (current) | ||
| FY2028 consensus | ~$24.5 | |||
| Base | 45% | ~$24.5 (FY2028) | 20-24x | $500-600 |
| Bull | 25% | $27-30 | 24-25x | $650-750 |
| Bear | 20% | $13-16 | 17-19x | $220-300 |
| Worst case | 10% | $11-13 | 12-14x | $130-180 |
Source: consensus from Yahoo Finance and Kaplio; author’s scenarios and weights; horizon about 12 months.
The asymmetry at entry
For CoreWeave at about $53, the loss scenarios (bear and worst case, with a combined weight of 45%) imply a decline of about 34% to 91% (to $5-35), and any subsequent recovery after dilution reduces the upside for existing shareholders. There are two winning scenarios: the base case, weighted at 35%, gives a gain of about 51% to 107% (to $80-110), and the bull case, weighted at 20%, a gain of about 126% to 182% (to $120-150). With these weights the probability-weighted price at the midpoints of the ranges is about $70, or about 32% above the current level.
For Applied Materials at about $370, the loss scenarios (bear and worst case, with a combined weight of 30%) imply a decline of about 19% to 65% (to $130-300). The base case, weighted at 45%, gives a gain of about 35% to 62% (to $500-600), and the bull case, weighted at 25%, a gain of about 75% to 102% (to $650-750). The probability-weighted price is about $490, also about 32% above the current level.
On the weights in this analysis, expected return is almost identical. The difference lies in dispersion and in the risk of permanent loss: for CoreWeave the probability of loss is 45% and the worst case almost wipes out the equity; for Applied the probability of loss is 30% and the worst case is a cyclical decline with no restructuring risk. Position size is therefore set by the loss budget. For CoreWeave, a 1.5% position and a 90% loss cost the portfolio about 1.35%; for Applied, a 4% position and a 65% loss cost about 2.6%. The asymmetry in Applied is positive and a 3-5% position is justified at the current weights, while for CoreWeave the position stays below 1-2%.
Weighted scenarios
| Scenario | CoreWeave weight | CoreWeave (indicative) | Change | Applied weight | Applied Materials (indicative) | Change |
|---|---|---|---|---|---|---|
| Base | 35% | $80-110 | +51% to +107% | 45% | $500-600 | +35% to +62% |
| Bull | 20% | $120-150 | +126% to +182% | 25% | $650-750 | +75% to +102% |
| Bear | 30% | $20-35 | -34% to -62% | 20% | $220-300 | -19% to -41% |
| Worst case | 15% | $5-15 | -72% to -91% | 10% | $130-180 | -51% to -65% |
| Probability-weighted price | ~$70 | +32% | ~$490 | +32% |
Source: author’s scenarios and weights; change is measured from the closing prices on November 13, 2026 ($53.13 and $370.50); horizon about 12 months.
Applied Materials: historical valuation multiples
| Period | Forward price/earnings ratio |
|---|---|
| Previous sector corrections (e.g. 2018-2019 and 2022) | 10-14x |
| Five-year average | ~21x |
| Peak, June 30, 2026 | ~49x |
| Current level (on FY2027) | ~19-20x |
| Bear case in this analysis | 17-19x |
| Worst case in this analysis | 12-14x |
Source: TIKR (five-year average and June 2026 peak), Yahoo Finance (FY2027 consensus); the range for previous corrections is the author’s estimate.
What the analysis leaves out
There is no full public breakdown of floating- versus fixed-rate debt after hedging, nor of the exact covenant thresholds, which makes the sensitivity table approximate. The extent to which the backlog rests on firm take-or-pay terms rather than more flexible ones is not fully transparent. Secondary-market data on the residual value of GPUs are limited and volatile. For Applied Materials there is no detailed forecast of China revenue under different levels of export restrictions. The path of the Federal Reserve and the length of the AI capital spending cycle remain external variables with high uncertainty. These gaps mean that the scenario weights rest on judgment rather than being fully determined by the data.
Both faces remain
Janus does not choose one face over the other. He simply holds both at once, because every beginning contains both directions. The same is true of the AI infrastructure cycle. On one side, CoreWeave shows what happens when capital expenditure is funded mainly with debt: interest already absorbs between 22% and 27% of revenue, and a delay in capacity acceptance or a widening in spreads creates a cash shortfall and a risk of dilution. On the other, Applied Materials shows what happens when the same cycle is funded from internal resources: free cash flow covers capital expenditure, and the worst case is limited to a cyclical decline in revenue and multiples. Together the two companies give a fuller picture of the sector: not only how strong demand is, but who carries the weight of capital spending and debt. Whoever looks at only one face sees only half the story.
Frequently asked questions
Why is CoreWeave far more sensitive to rising interest rates than Applied Materials?
Because CoreWeave carries about $46.9bn of total debt, of which about $41.6bn is recourse to the company; interest already absorbs between 22% and 27% of revenue, and maturities in 2027 alone are almost $11bn. At Applied Materials interest expense is about $274m a year, or about 0.8% of revenue, and the company has a net cash position. Higher rates hit CoreWeave directly through refinancing, whereas for Applied the effect is mostly indirect, through slower demand for equipment.
What does GPU residual-value risk mean for CoreWeave?
A significant part of CoreWeave’s debt is secured by GPUs whose secondary-market value depreciates quickly. If utilization lags, the collateral may fall below levels acceptable to lenders, and new capital becomes more expensive. The company says GPUs coming off contract are being re-signed at higher prices, but this needs to be confirmed quarter by quarter.
Why does customer concentration remain a problem for CoreWeave even though it is lower?
Because in the third quarter of 2026 two customers still accounted for about 30% and 24% of revenue, and historically Microsoft reached about 67%. Those same large customers are building capacity of their own, and Microsoft is already reducing the number of its neocloud partners.
What does the asymmetry between loss and gain scenarios show at entry?
On the weights in this analysis, both CoreWeave and Applied Materials have a probability-weighted expected return of about 32%. For CoreWeave, however, the probability of loss is 45% and the worst case almost wipes out the equity, while for Applied the probability of loss is 30% and the worst case is a cyclical decline of 51-65%. That is why the CoreWeave position is below 1-2% and the Applied position 3-5%.
Why is China exposure a structural risk for Applied Materials rather than merely a cyclical one?
Because China’s share of revenue has fallen from 37% in fiscal 2024 to 27% in 2026 as a result of export restrictions, and the company paid $253m under a settlement over export control violations. This shrinks the long-term addressable market, although Applied says it is gaining share in China at 28nm. Combined with a cyclical downturn, the worst case takes the price toward $130-180 despite the strong balance sheet.
Further reading
- Hot Inflation and Expensive AI Infrastructure Debt
- The AI Stock Selloff in November 2026: Lost Value, Leverage and What Comes Next
- AMD and Qualcomm: Two Different Paths Through the AI Cycle
- Jensen Huang and Nvidia: The Facts, the Risks, and What We Still Don’t Know
Sources
CoreWeave, third-quarter 2026 results (November 10, 2026)
CoreWeave, Form 10-Q for the quarter ended September 30, 2026 (SEC)
CoreWeave, Form 10-K for 2025 (SEC)
CoreWeave, Form 8-K of September 15, 2025 (Nvidia unsold-capacity agreement)
CoreWeave, Q3 2026 earnings call transcript (The Motley Fool)
CNBC, CoreWeave Q3 2026 earnings
CNBC, Microsoft consolidates its neocloud relationships (November 6, 2026)
Quartz, citing Bloomberg, on an investment-grade loan of at least $4bn
ChartExchange, CRWV short interest and Finviz, CRWV
Applied Materials, Q4 and fiscal 2026 results (November 12, 2026)
Applied Materials, Form 10-K for FY2024 (SEC)
Yahoo Finance, AMAT consensus and Kaplio, revenue consensus
TIKR, AMAT historical multiples
Investing.com, Applied earnings analysis and Yahoo Finance, post-earnings reaction