

Analysis of Tesla’s and Meta’s third-quarter 2026 reports
Key Takeaways
- Tesla: revenue of $28.05 billion (almost unchanged), operating margin of 2.6 %, free cash flow of $1.53 billion. The positive cash flow comes from lower capital expenditure, and full-year guidance of about $20 billion implies roughly $7 billion in Q4, more than operating cash flow.
- Meta: revenue of $64.6 billion (+26 %), operating margin of 35 % excluding the one-time $9.89 billion charge for legal settlements (20 % under GAAP), but capital expenditure of $34.9 billion now exceeds operating cash flow and free cash flow is negative (-$2.12 billion).
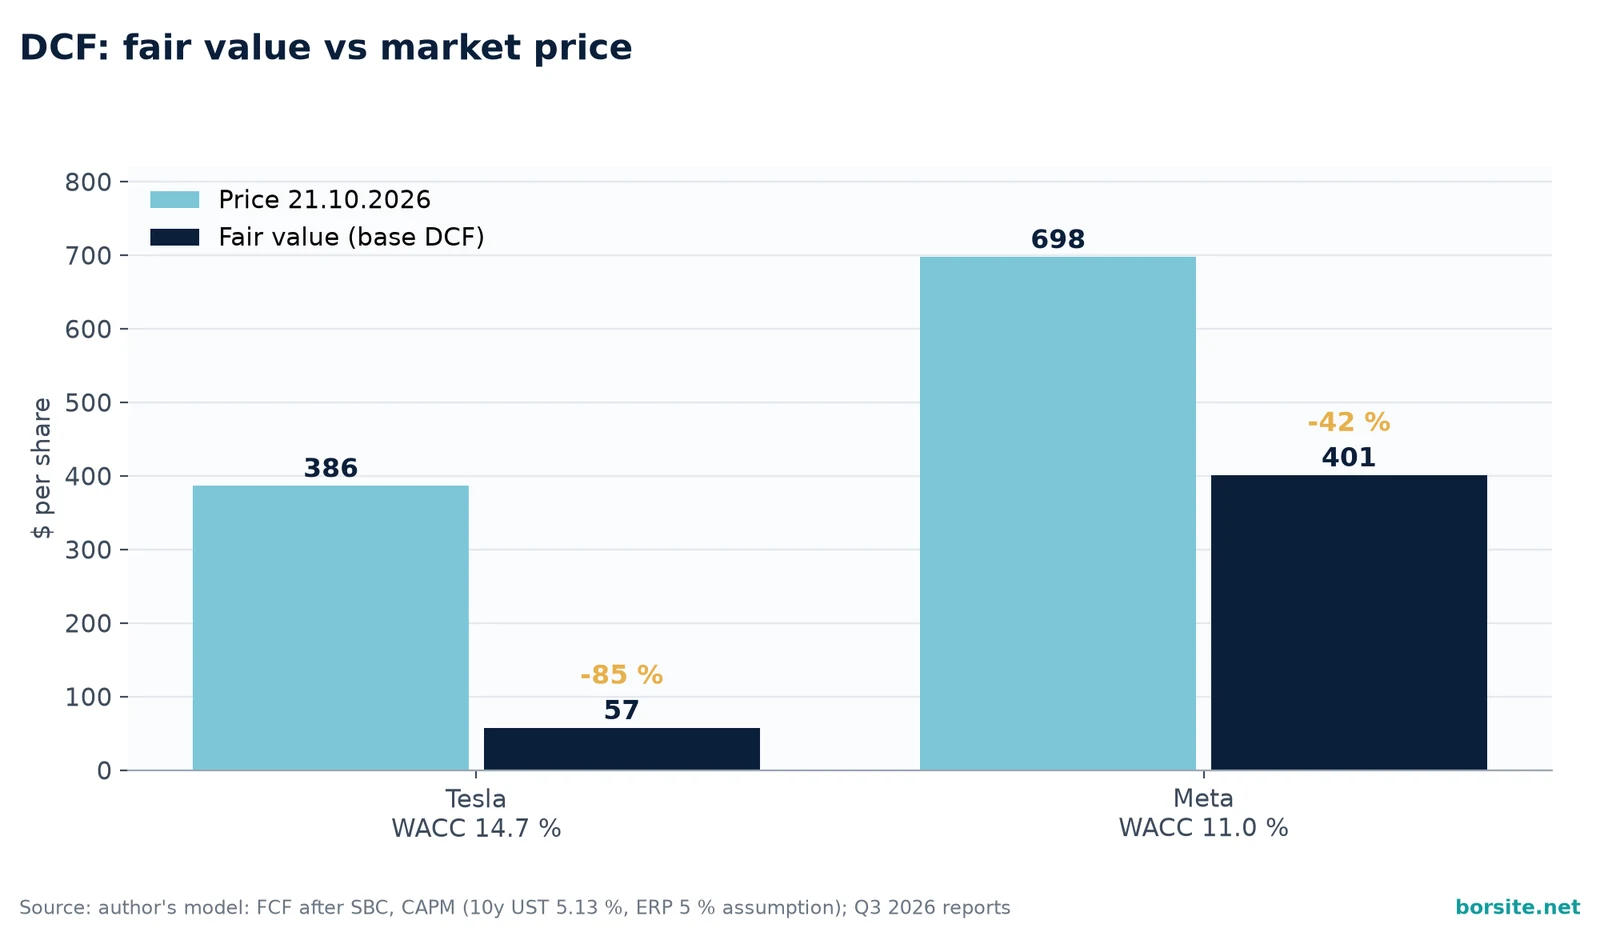
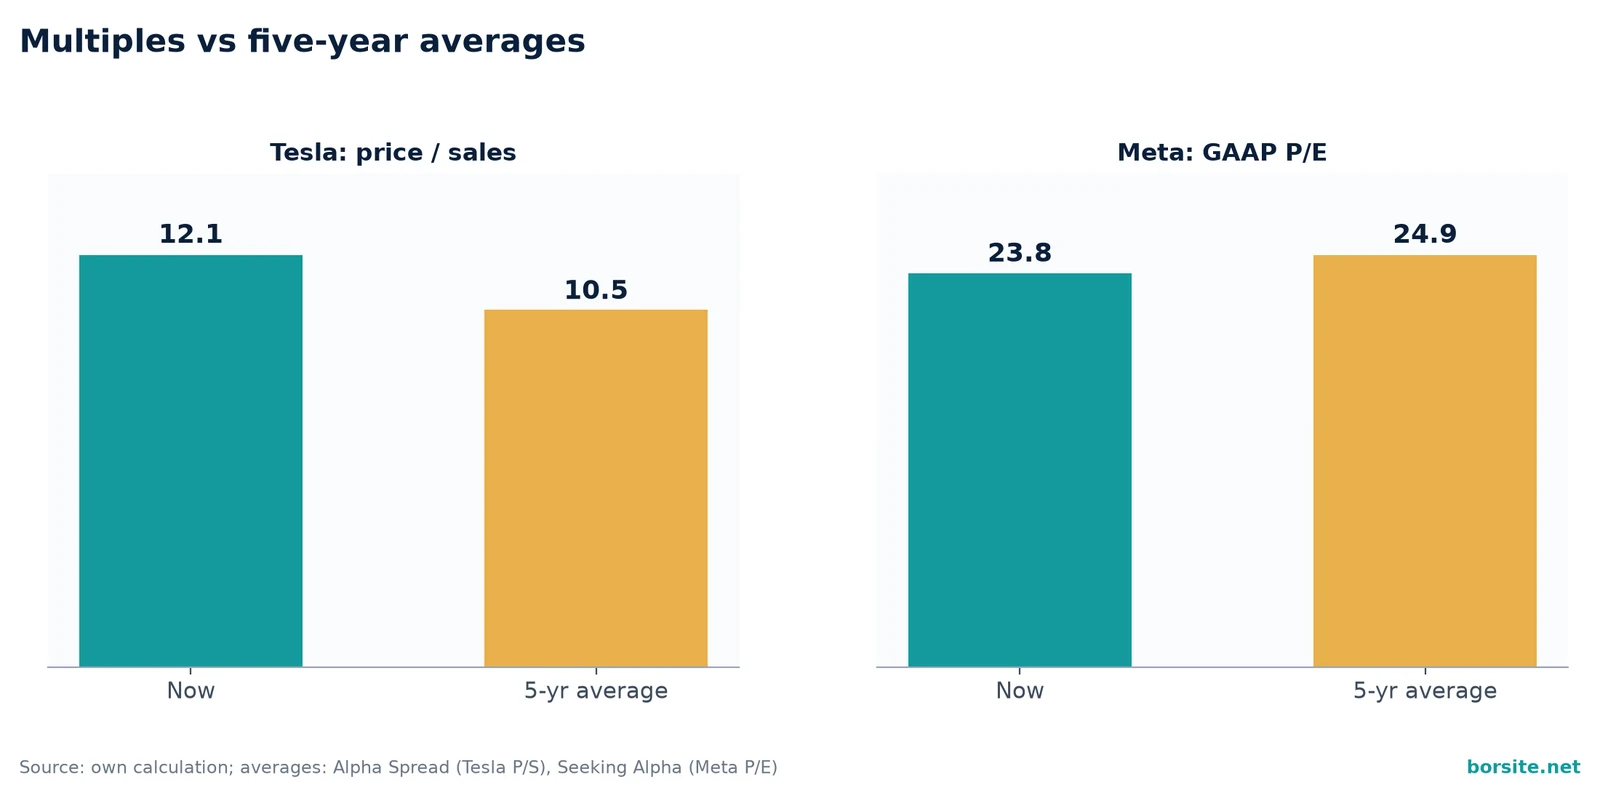
- Valuation: a DCF model using free cash flow after SBC and a CAPM-based WACC (10-year UST at 5.13 %) gives a fair value of about $57 for Tesla (price $386.47) and about $401 for Meta (price $697.52). Tesla’s price requires annual revenue growth of about 70 % in years 2-5; Meta’s requires about 26 %. Meta trades close to its five-year average P/E, while Tesla trades above its five-year average P/S.
- Position: Meta - hold, provided Q4 guidance is confirmed; Tesla - limited size, to be increased only on proven growth in operating profitability or a quantified contribution from Robotaxi. This is an opinion, not advice.
Ave, Caesar, those who are about to die salute you!
In the Roman amphitheatres every spectator had a favourite gladiator. Spiculus, Nero’s favourite, received a palace like a victorious general. Flamma entered the arena thirty-four times and refused his freedom four times. Priscus and Verus fought so evenly at the opening of the Colosseum that Titus freed them both, and Martial wrote: two fought, and both won.
Today the arena is earnings season. Tesla and Meta step into it every three months, and the crowd answers with orders. The difference is that the blow is not visible at once. It is read in the margins, in the quality of revenue and in whether cash flow can bear the weight of capital expenditure.
Tesla - Third Quarter of 2026
Last share price as of 21 October: about $386.47.
Key Figures
| Indicator | Value | Change |
|---|---|---|
| Total revenue | $28.05 billion | almost unchanged (-0.2 %) |
| Operating income | $718 million | -56 % |
| Operating margin | 2.6 % | - |
| Net income (GAAP) | $787 million | -43 % |
| EPS (adjusted) | $0.48 | above consensus |
| Free cash flow | $1.53 billion | positive surprise |
| Capital expenditure | $4.73 billion | below expectations |
| Cash and investments | $45.4 billion | - |
Revenue Breakdown and Concentration
| Division | Revenue ($ billion) | Share | Year-on-year change |
|---|---|---|---|
| Automotive | 20.6 | ~73 % | -3 % |
| Energy | ~2.9 | ~10 % | -16 % |
| Services and other | ~4.6 | ~16 % | +33 % |
| Total | 28.05 | 100 % | almost 0 % |
Automotive revenue was $20.6 billion, down 3 % year on year. Total revenue was $28.05 billion, slightly above analysts’ expectations of $27.88 billion (LSEG). The energy segment reported about $2.9 billion, down 16 % despite deployments rising to 13.7 GWh. Services and other revenue grew by about a third to $4.6 billion. Automotive remains the dominant source of revenue, with a share of about 73 %. The energy segment, long presented as the second growth engine, is shrinking. Services are growing, but from a lower base.
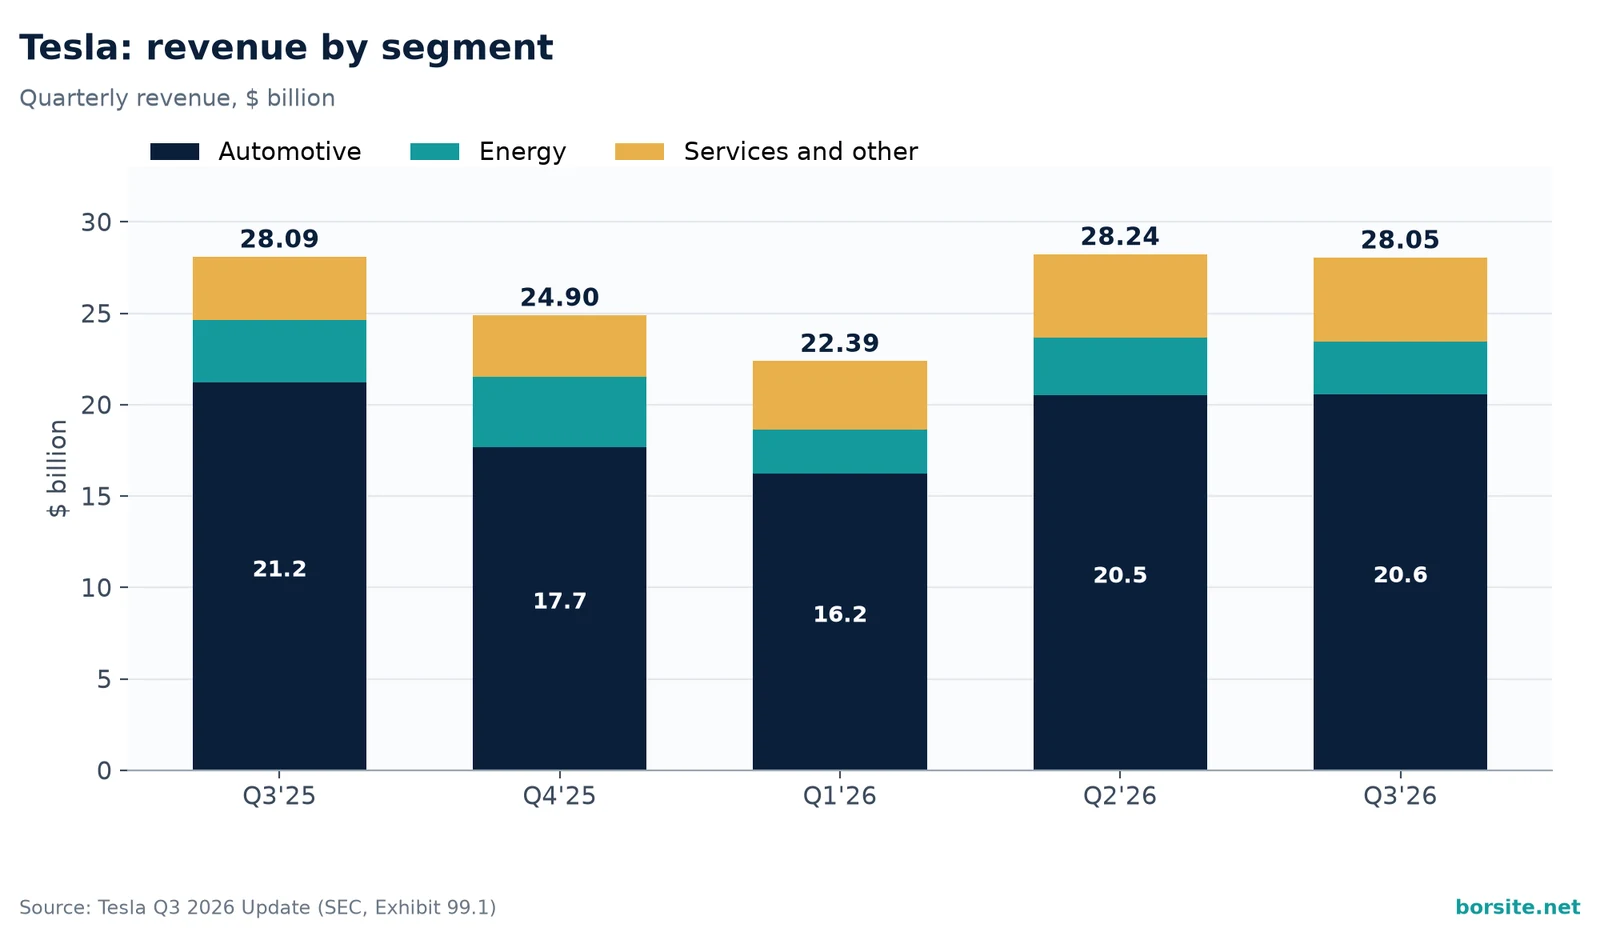
Concentration is high. If the automotive segment falls by another 5 % over the coming quarters while energy and services stay at their current levels, total revenue would shrink by about $1 billion. This is a vulnerability that the headline revenue figure alone does not reveal. The quality of revenue is unimpressive: the core segment is not growing, the second is shrinking and the third is still small.
Volumes confirm the picture. Deliveries were 486,532 vehicles, about 2 % fewer than the 497,099 a year earlier, while production rose by about 4 % to 464,391. The company cites battery availability as the main constraint on volumes. The decline in automotive revenue (-3 %) is larger than the decline in deliveries, which also reflects a lower average selling price. The record backlog suggests that the constraint lies in supply rather than demand, but this has yet to show up in Q4 deliveries.
Costs, Margins and Profit
Operating expenses rose by 39 % to $4.8 billion, mainly because of research and development for artificial intelligence and Optimus. Operating income fell by 56 % to $718 million, a margin of 2.6 %. GAAP net income was $787 million (-43 % year on year). Adjusted EPS of $0.48 beat the consensus of $0.43 (LSEG). Regulatory credits fell to $113 million from $417 million a year earlier.
GAAP net income also contains non-operating effects. The unrealised gain on digital assets (bitcoin) was $288 million before tax ($224 million after tax), while the unrealised loss on the SpaceX stake was $142 million before tax ($108 million after tax). Net, the two effects add about $116 million; without them GAAP net income would have been about $671 million. The effect was even larger in Q2 2026, when the revaluation of SpaceX added $1.005 billion before tax. Trailing twelve-month GAAP earnings, and with them the P/E ratio, therefore depend on market revaluations and not only on the business. Adjusted earnings exclude both effects.
The automotive gross margin excluding credits was 18.1 %, an improvement on the previous quarter. The total gross margin recovered to 19.6 % from 16.8 % in the previous quarter. Gross profitability is improving, including in services, where the gross margin reached a record 15.9 %. The main pressure on profit therefore lies not in the cost of vehicles but below the gross line, in operating expenses.
| Indicator | Value |
|---|---|
| Automotive gross margin excluding credits | 18.1 % |
| Total gross margin | 19.6 % |
| Operating margin | 2.6 % |
| Gap between gross and operating margin | ~17 percentage points |
The gap of about 17 percentage points between gross and operating margin shows the weight of operating expenses. If these expenses keep growing faster than revenue, the operating margin will remain under pressure even if the automotive gross margin stabilises. Management itself warns that operating expenses will keep rising until the new products are commercialised.
Cash Flow, Capital Expenditure and Financing
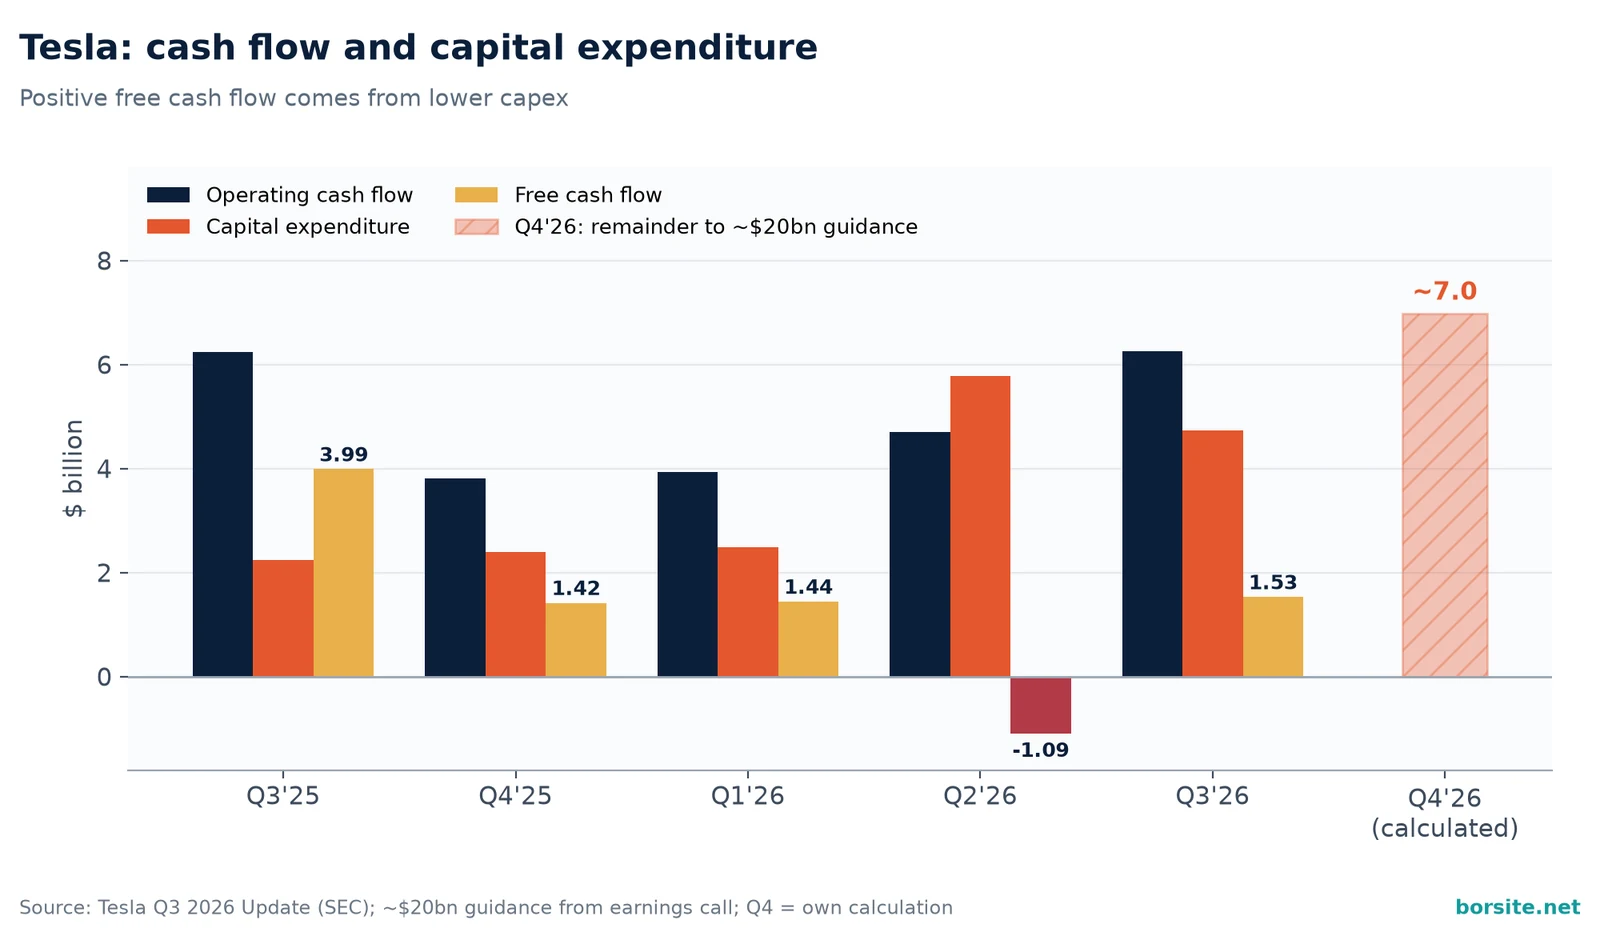
Free cash flow was $1.53 billion, a positive surprise against expectations of cash burn. Operating cash flow was $6.3 billion. At the end of the period cash and investments stood at $45.4 billion. The positive free cash flow is mainly the result of lower capital expenditure rather than faster operating cash generation from the core business.
Capital expenditure for the quarter was $4.73 billion, well below expectations of about $7.5 billion (LSEG) but double the level of a year earlier ($2.25 billion). The company cut its full-year guidance to about $20 billion from the previous guidance of more than $25 billion. Management says it plans to fund capital expenditure mainly from operating cash flow.
| Indicator | Value ($ billion) | Share of operating cash flow |
|---|---|---|
| Operating cash flow | 6.3 | 100 % |
| Capital expenditure | 4.73 | 75 % |
| Free cash flow | 1.53 | 24 % |
Capital expenditure accounts for 75 % of operating cash flow. Free cash flow is positive but small. If capital expenditure returns to the levels of previous quarters, free cash flow will quickly turn negative. Full-year guidance of about $20 billion leaves about $7.0 billion for the fourth quarter (20 - 2.49 - 5.79 - 4.73), more than the $6.26 billion of operating cash flow in the third quarter. With similar operating cash flow, Q4 free cash flow is likely to be around zero or negative. This is temporary flexibility, not a structural change.
Customers and Revenue from Them
Automotive revenue depends on end customers. Active Full Self-Driving users (subscriptions and one-off purchases, excluding free trials) reached 1.74 million, up from 1.04 million a year earlier, and more than 75 % of new deliveries in North America included paid Full Self-Driving, almost 20 percentage points more than in the previous quarter. For the first time, half of paying customers are on a subscription. There is no disclosure of revenue concentration among individual corporate customers. The energy segment reports tariff-related refunds to customers, which contributed to the decline in revenue. The lack of a clear breakdown of Full Self-Driving’s contribution to vehicle deliveries leaves open the question of whether it really drives demand or is still an add-on with a limited contribution to volume.
Management Guidance and Critical Analysis
Management cut its capital expenditure guidance to about $20 billion for the year. Elon Musk stressed that Full Self-Driving is the biggest driver of vehicle demand, that the Cybercab fleet in Austin has grown tenfold in about a month since launch and that Optimus has started production. The company reported its largest passenger-vehicle backlog in four years. No numerical guidance was given for deliveries or revenue. Musk said Robotaxi will begin to show up in the financial results in the second quarter of 2027.
The message emphasises future products while current operating profitability remains low. The cut in capital expenditure is presented as efficient management, but it also slows the pace of investment in the new businesses. The absence of numerical guidance on volume and revenue leaves the market dependent on qualitative claims. The emphasis on Full Self-Driving is not backed by a quantitative breakdown of its contribution to deliveries. This is the typical move of a gladiator who talks about the next fight while the current one is not yet over.
Red Flags and Opportunities
Operating profitability squeezed to 2.6 % on almost unchanged revenue. Regulatory credits disappearing. Energy revenue falling despite higher deployments. Positive free cash flow dependent on lower capital expenditure. Concentration of about 73 % in an automotive segment that is not growing.
Opportunities: growth in Full Self-Driving subscriptions, a possible recovery in the energy segment, flexibility from reduced capital expenditure and a strong net cash position.
Ratios and Strategy
At a price of about $386.47, market capitalisation is about $1.25 trillion (about 3.24 billion shares; about $1.37 trillion on a diluted basis). The trailing twelve-month GAAP P/E is above 400 (EPS of $0.91), and about 225 on adjusted EPS ($1.72). The price-to-sales ratio is about 12 on trailing twelve-month revenue of $103.6 billion. The valuation remains heavily dependent on the future contribution of Full Self-Driving, Robotaxi and Optimus rather than on current operating profitability. The market is paying for an expected future contribution that is not yet visible in the report.
A position of limited size is appropriate, to be increased only on a confirmed recovery in operating profitability or a quantitatively proven contribution of Full Self-Driving to volume.
Valuation Scenarios
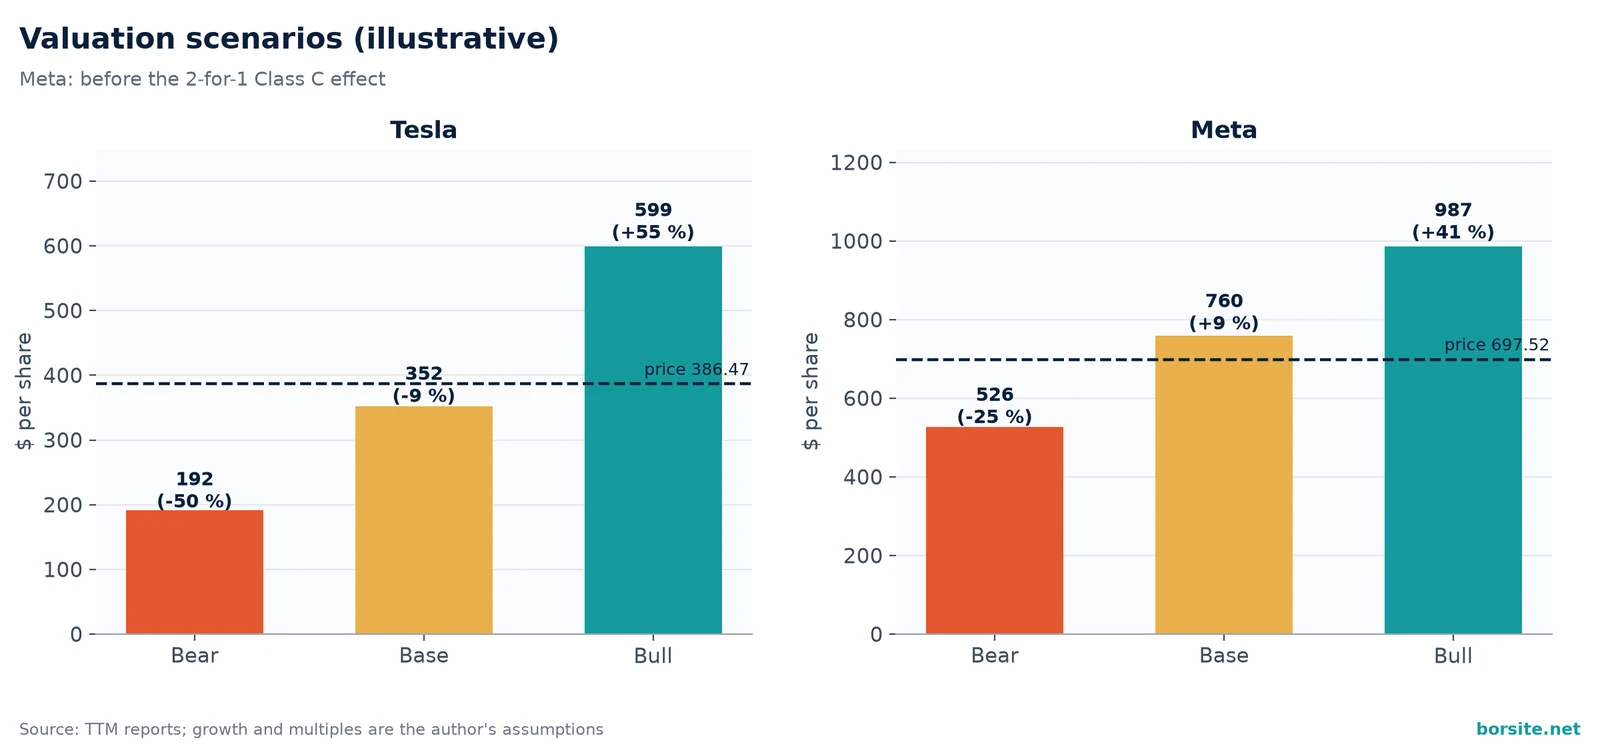
The scenarios are illustrative and are not a forecast. The factual base is verified: trailing twelve-month revenue of $103.6 billion and about 3.24 billion shares. Revenue growth over the next twelve months and the price-to-sales ratio are assumptions. The bear case assumes zero growth and a re-rating to 6 times sales, the base case 10 % growth and 10 times, and the bull case 25 % growth and 15 times sales, with a visible contribution from Robotaxi and Full Self-Driving.
| Scenario | Revenue growth (assumption) | Price/sales (assumption) | Value per share | vs $386.47 |
|---|---|---|---|---|
| Bear | 0 % | 6 | ~$192 | -50 % |
| Base | 10 % | 10 | ~$352 | -9 % |
| Bull | 25 % | 15 | ~$599 | +55 % |
The conclusion is that the current price is already close to the base case, and the downside is larger than the upside unless the bull case materialises. The asymmetry supports a position of limited size. The multiple-based scenarios are more generous than the DCF model below, because they assume the market will keep paying a high multiple for future products.
DCF Model: Fair Value and Reverse DCF
Method: discounted free cash flow over 10 years plus a terminal value using the Gordon growth formula. Free cash flow is taken after stock-based compensation (SBC), because it is a real cost to shareholders. Enterprise value is bridged to equity value through net cash (cash and investments minus debt and finance leases; operating leases are left in cash flow), and digital assets and the SpaceX stake are added separately as non-operating assets. The cost of capital is based on CAPM. The result is divided by the diluted share count, increased by an assumed additional dilution of 0.5 % a year.
| Item | Value | Type | Source |
|---|---|---|---|
| Trailing twelve-month revenue | $103.57 billion | fact | Tesla Q3 2026 Update (SEC) |
| Free cash flow (12 months) | $3.30 billion | fact | Tesla Q3 2026 Update (SEC) |
| Stock-based compensation, SBC (12 months) | $4.30 billion | fact | Tesla Q3 2026 Update (SEC) |
| Free cash flow after SBC / margin | -$1.00 billion / -0.96 % | calculated | - |
| Cash and short-term investments | $45.45 billion | fact | balance sheet as of 30.09.2026 |
| Debt and finance leases | $9.52 billion | fact | balance sheet as of 30.09.2026 |
| Digital assets | $0.96 billion | fact | balance sheet as of 30.09.2026 |
| SpaceX stake | ~$2.87 billion | calculated | purchase 2.00 + revaluations 1.01 - 0.14 |
| Diluted shares | 3.541 billion | fact | Tesla Q3 2026 Update (SEC) |
| Risk-free rate (10-year UST) | 5.13 % | fact | US Treasury, 21.10.2026 |
| Beta (5-year, monthly) | 1.92 | fact | Yahoo Finance |
| Equity risk premium (ERP) | 5.0 % | assumption | - |
| Pre-tax cost of debt / tax rate | 6.0 % / 21 % | assumption | - |
| Cost of equity (CAPM) | 14.73 % | calculated | 5.13 % + 1.92 x 5.0 % |
| WACC | 14.66 % | calculated | market-value weights of equity and debt |
| Revenue growth: year 1 / years 2-5 | 13 % / 20 % | assumption | year 1 close to consensus |
| Years 6-10 | fading to 3 % | assumption | - |
| Target free cash flow margin after SBC | 12 % by year 10 | assumption | - |
| Terminal growth / additional dilution | 3.0 % / 0.5 % a year | assumption | - |
| Result | Value |
|---|---|
| Enterprise value (EV) | $174 billion |
| Terminal value share of EV | 60 % |
| + net cash and non-operating assets | $39.8 billion |
| Fair value per share | $57 |
| Market price (21.10.2026) | $386.47 |
| Difference from price | -85 % |
| Reverse DCF: required revenue growth in years 2-5 | 70.3 % a year |
| WACC / terminal growth | 2.0 % | 2.5 % | 3.0 % | 3.5 % | 4.0 % |
|---|---|---|---|---|---|
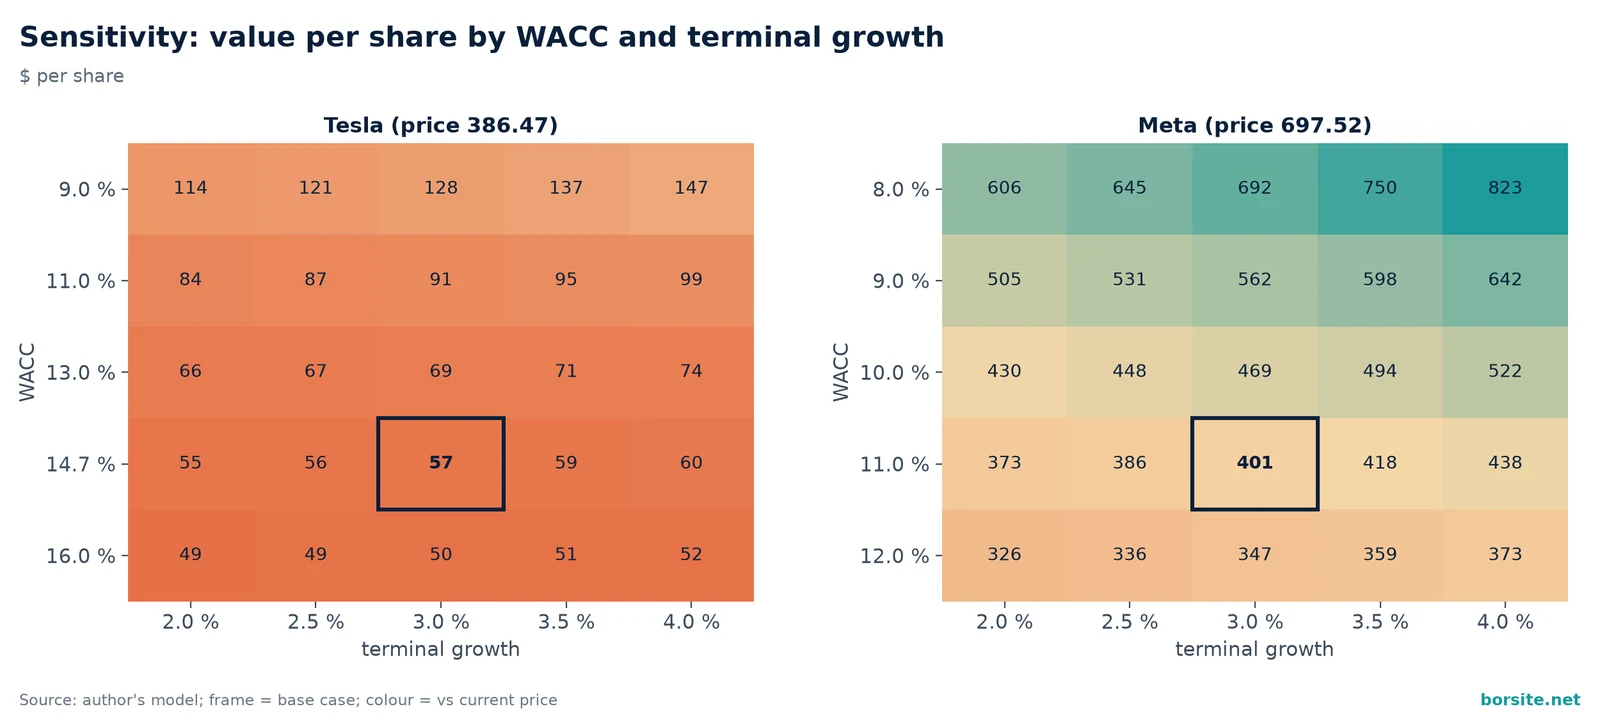
| 9.0 % | 114 | 121 | 128 | 137 | 147 |
| 11.0 % | 84 | 87 | 91 | 95 | 99 |
| 13.0 % | 66 | 67 | 69 | 71 | 74 |
| 14.7 % (base) | 55 | 56 | 57 | 59 | 60 |
| 16.0 % | 49 | 49 | 50 | 51 | 52 |
With a beta of 1.92, the cost of equity is 14.7 % and fair value is about $57. Even at a WACC of 9 % and terminal growth of 4 %, it is about $147. To reach the current price at the base-case WACC, revenue would have to grow by about 70 % a year in years 2-5, reaching about $3.5 trillion in year ten. This shows in numbers that the price is not justified by the cash flow of the current business and includes a large option value for Robotaxi, Optimus and artificial intelligence. The model is strict: Tesla currently has negative free cash flow after SBC (-$1.0 billion over twelve months).
Against Its Own History
The current price-to-sales ratio of about 12 is above the five-year average of about 10.5 (Alpha Spread). The five-year average P/E is about 200 (FinanceCharts, as of 30.06.2026), while the current GAAP P/E is above 400, partly because of shrunken earnings.
Analyst Consensus
| Period | Revenue (consensus) | Adjusted EPS (consensus) | Source |
|---|---|---|---|
| Q4 2026 | ~$28.8 billion | $0.47-0.49 | Yahoo Finance, WSJ |
| 2027 | $121.1-121.7 billion | $2.17-2.28 | Yahoo Finance, WSJ |
Sources: Yahoo Finance and WSJ as of 22.10.2026. The consensus expects revenue growth of about 13 % in 2027. At $2.17-2.28, the price is about 170-178 times expected 2027 earnings.
Robotaxi and Optimus: An Option, Not the Base Case
Company-stated timelines: Cybercab in Dallas in November 2026 and in more cities by year-end; limited Cybercab deliveries to customers by the end of 2026; the first customer-owned Model Y vehicles joining the Robotaxi fleet around Q2 2027; a target of 30 cents per mile. According to Musk, Robotaxi will become noticeable in the financials from Q2 2027. For Optimus: the AI5 chip around April 2027, a line for about 1 million units a year (about 20,000 a week) that will take at least a year to reach, and first external customers in about a year. These timelines are management targets, and Tesla’s history shows frequent delays. We therefore treat them as a highly uncertain option rather than part of the base case.
Meta - Third Quarter of 2026

Last share price as of 21 October: about $697.52.
Key Figures
| Indicator | Value | Change |
|---|---|---|
| Total revenue | $64.6 billion | +26 % |
| Operating income (GAAP) | $12.99 billion | -37 % |
| Operating margin (GAAP) | 20 % | - |
| Operating income excluding legal settlement charge | ~$22.9 billion | - |
| Operating margin excluding legal settlement charge | ~35 % | - |
| EPS (GAAP) | $3.83 | - |
| Free cash flow | -$2.12 billion | negative |
| Capital expenditure | ~$34.9 billion | - |
| Cash and marketable securities | $82.45 billion | - |
Revenue Breakdown and Concentration
| Division | Revenue ($ billion) | Share | Year-on-year change |
|---|---|---|---|
| Family of Apps | 64.16 | ~99 % (advertising ~98 %) | +26 % |
| Reality Labs | 0.443 | ~1 % | -6 % |
| Total | 64.6 | 100 % | +26 % |
Total revenue was $64.6 billion, up 26 % and above consensus. Family of Apps reported $64.16 billion. Ad impressions grew by 10 % and the average price per ad by 14 %. Reality Labs reported $443 million, down 6 %. Almost all of the growth comes from the advertising business. Concentration is very high: advertising alone brings in $63.06 billion, or about 98 % of revenue, and Family of Apps as a whole about 99 %. If the average price per ad fell by 5 % with impression volume unchanged, revenue would shrink by about $3 billion. This is a vulnerability offset by current strong growth, but it does not go away. Revenue quality is high within a single segment, but the dependence on the advertising market remains.
Costs, Margins and Profit
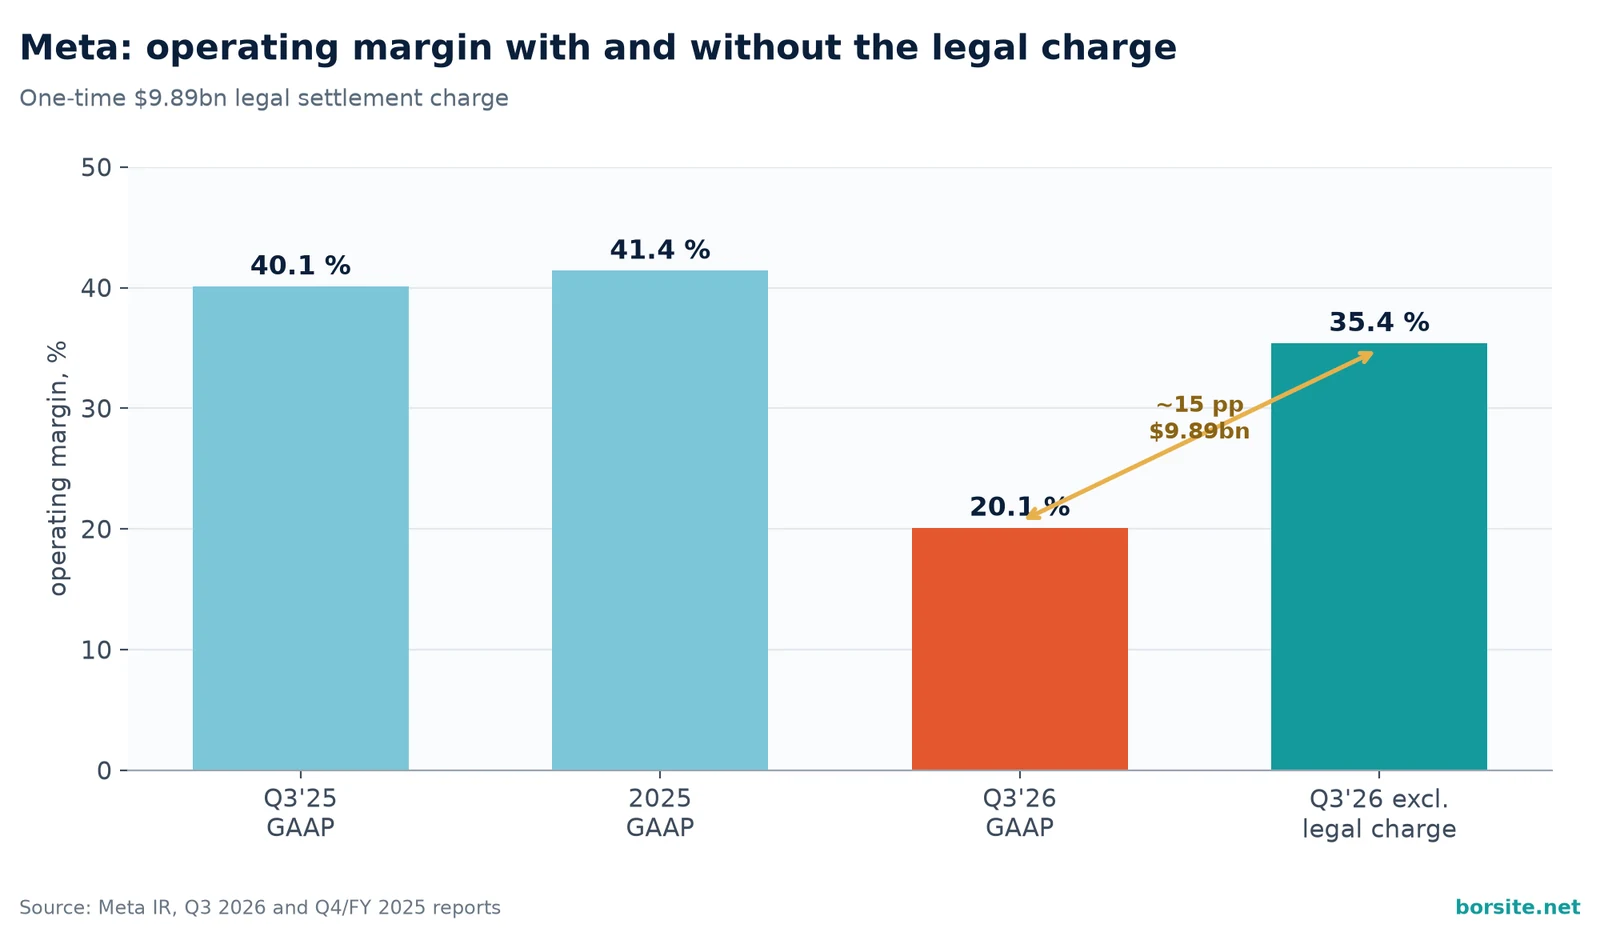
Total costs and expenses were $51.6 billion, up 68 %, including a one-time $9.89 billion charge for legal settlements. Operating income was $12.99 billion, a margin of 20 %. Excluding the legal charge, operating income would have been about $22.9 billion, a margin of about 35 %. Reality Labs continues to generate a significant operating loss: $4.13 billion for the quarter.
| Indicator | Value |
|---|---|
| Operating margin (GAAP) | 20 % |
| Operating margin excluding legal charge | ~35 % |
| Gap due to legal charge | ~15 percentage points |
| Effect on profit | $9.89 billion |
The gap of about 15 percentage points shows how strongly the one-time legal charge distorts the picture. Even without it, the core business remains highly profitable, but 35 % is below the 40 % of a year earlier and the 41 % for full-year 2025. In other words, the margin is shrinking by about 5 percentage points even excluding the one-time settlement charge, mainly because of spending on artificial intelligence.
Cash Flow, Capital Expenditure and Financing
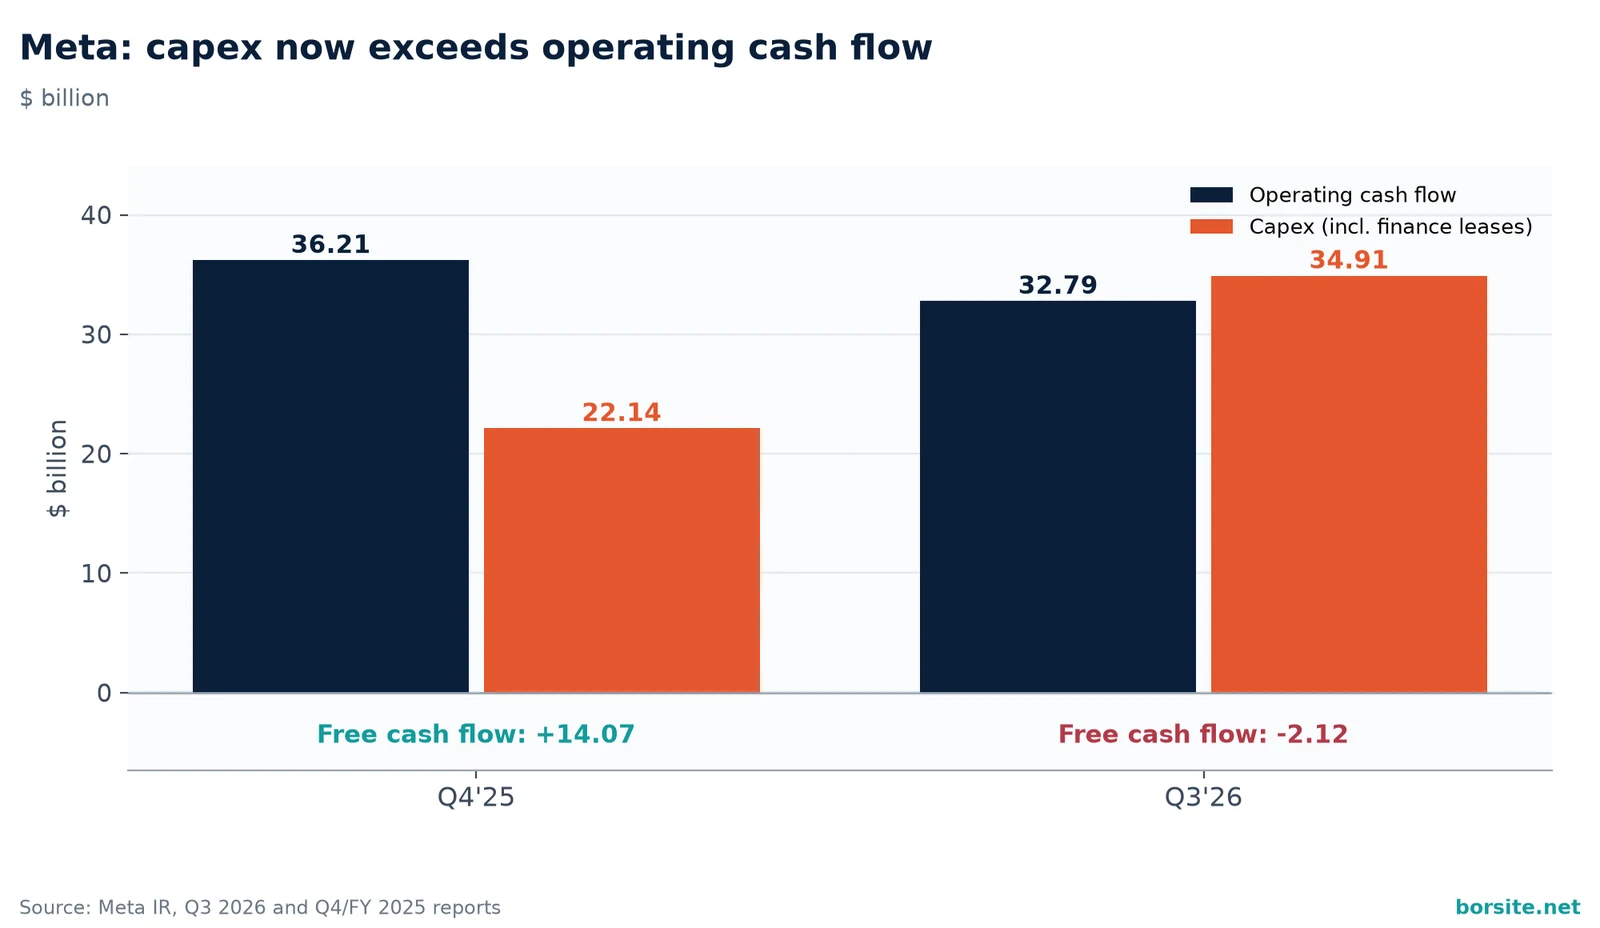
Free cash flow was negative at $2.12 billion. Operating cash flow was $32.79 billion. Capital expenditure for the quarter was about $34.9 billion. Full-year guidance was narrowed to $135-145 billion. The company announced a new listed, non-voting Class C share, intended for raising capital, employee compensation, acquisitions and general corporate purposes. Each shareholder will receive one Class C share for every Class A and Class B share (an effect similar to a 2-for-1 split), expected in January 2027.
| Indicator | Value ($ billion) | Share of operating cash flow |
|---|---|---|
| Operating cash flow | 32.79 | 100 % |
| Capital expenditure | ~34.9 | 106 % |
| Free cash flow | -2.12 | negative |
Capital expenditure exceeds operating cash flow. Free cash flow is negative because investment in artificial intelligence infrastructure is running ahead of the cash being generated. The core business is strong, but current investment is absorbing it.
Customers and Guidance
Most revenue comes from advertisers. Nearly 10 million advertisers have used at least one generative AI tool. Fourth-quarter guidance is $73-76 billion of revenue. Reality Labs losses are expected in the range of $18-19 billion for 2026 and about $15 billion in 2027.
Mark Zuckerberg highlighted the launch of Muse and Muse Wonder and said the investments are paying off. Susan Li said that, excluding the legal charge, full-year operating income is expected to be above 2025. The message is more concrete than Tesla’s on revenue, but the high capital expenditure still lacks a clear quantitative link to future revenue from artificial intelligence.
Red Flags and Opportunities
A one-time legal payment that distorts GAAP profitability. Negative free cash flow amid high capital expenditure. Continuing Reality Labs losses. Concentration of about 98 % in advertising. Possible future dilution through Class C shares, with no change in the founder’s control.
Opportunities: strong growth in the advertising business, Q4 guidance above consensus, greater financing flexibility through Class C shares, a potential reduction in Reality Labs losses.
Ratios and Strategy
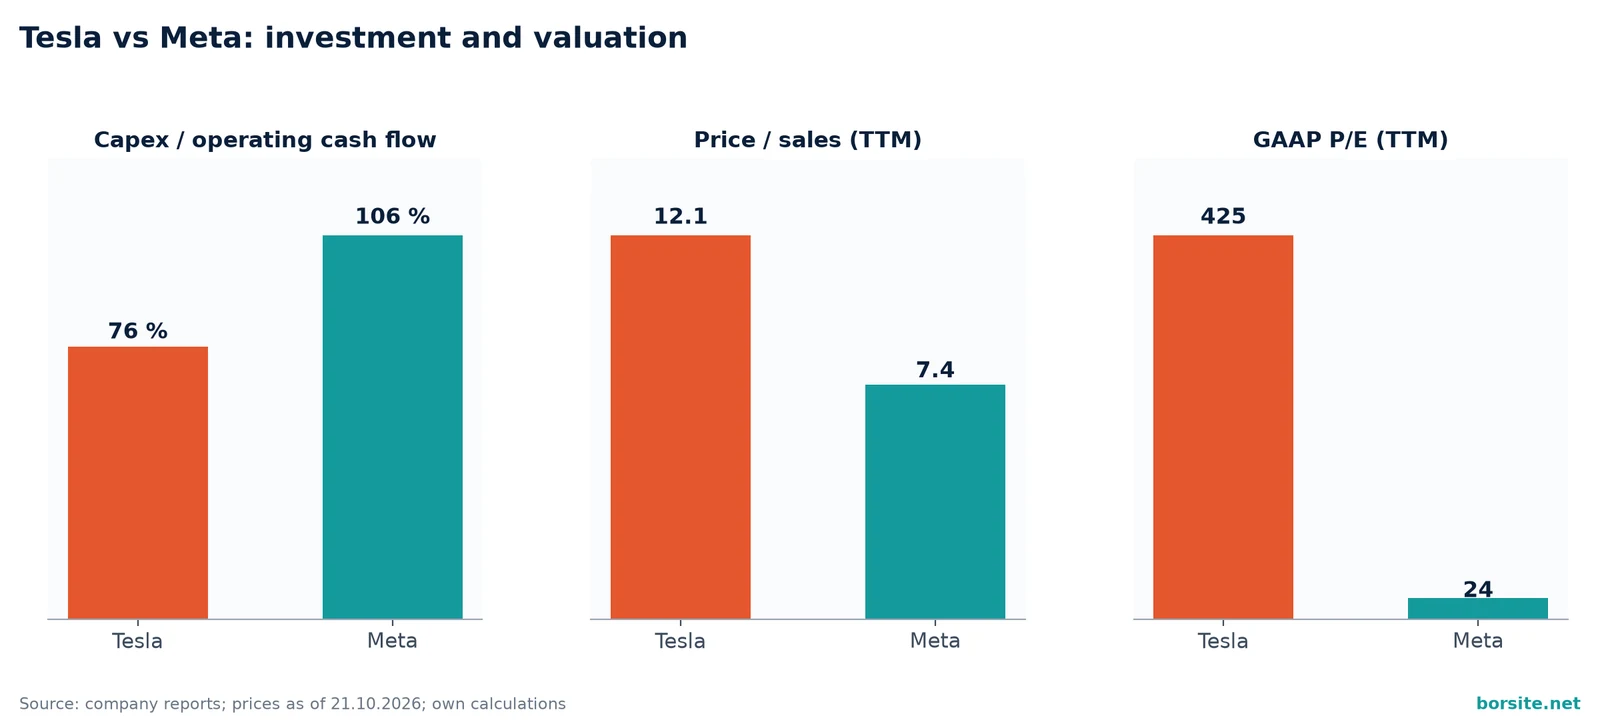
At a price of about $697.52, market capitalisation is about $1.8 trillion. The trailing twelve-month GAAP P/E is about 24 (EPS of $29.32), and about 21 excluding the legal settlement charge. The price-to-sales ratio is about 7.4 on trailing twelve-month revenue of $241.6 billion. The valuation is more moderate than Tesla’s but still depends on continued growth in advertising revenue and on the return on investment in artificial intelligence.
The core business is healthy. GAAP profitability is distorted by the one-time settlement charge, and free cash flow is negative. A position that is held as long as Q4 guidance is confirmed and no new material legal costs appear is appropriate.
Valuation Scenarios
The factual base is trailing twelve-month earnings per share excluding the legal settlement charge: $29.32 under GAAP plus $3.57 from that charge, or $32.89. Earnings growth and the P/E ratio are assumptions: bear case 0 % and 16 times, base case 10 % and 21 times, bull case 20 % and 25 times. The values are before the effect of the Class C share distribution, after which the Class A share price is expected to reflect the effect of a 2-for-1 split.
| Scenario | EPS growth (assumption) | P/E (assumption) | Value per share | vs $697.52 |
|---|---|---|---|---|
| Bear | 0 % | 16 | ~$526 | -25 % |
| Base | 10 % | 21 | ~$760 | +9 % |
| Bull | 20 % | 25 | ~$987 | +41 % |
For Meta the base case is close to the current price, and the bull case requires capital expenditure to start feeding back into earnings. Compared with Tesla, the asymmetry is more balanced.
DCF Model: Fair Value and Reverse DCF
The method is the same as for Tesla: free cash flow after SBC, 10 years plus a terminal value, CAPM, net cash and diluted shares with an assumed additional dilution of 0.5 % a year (Class C). Trailing twelve-month free cash flow after SBC is negative (-$1.8 billion) because of capital expenditure, so the margin is assumed to recover to 20 % over 5 years, close to the levels before the investment cycle.
| Item | Value | Type | Source |
|---|---|---|---|
| Trailing twelve-month revenue | $241.60 billion | fact | Meta IR, Q4 2025 and Q3 2026 |
| Free cash flow (12 months) | $25.13 billion | fact | 9M 2026 11.05 + Q4 2025 14.08 |
| Stock-based compensation, SBC (12 months) | $26.94 billion | fact | 9M 2026 21.05 + Q4 2025 5.89 |
| Free cash flow after SBC / margin | -$1.81 billion / -0.75 % | calculated | - |
| Cash and marketable securities | $82.45 billion | fact | balance sheet as of 30.09.2026 |
| Long-term debt | $80.92 billion | fact | balance sheet as of 30.09.2026 |
| Diluted shares | 2.573 billion | fact | Meta IR, Q3 2026 |
| Risk-free rate (10-year UST) | 5.13 % | fact | US Treasury, 21.10.2026 |
| Beta (5-year, monthly) | 1.23 | fact | Yahoo Finance |
| Equity risk premium (ERP) | 5.0 % | assumption | - |
| Pre-tax cost of debt / tax rate | 5.6 % / 21 % | assumption | - |
| Cost of equity (CAPM) | 11.28 % | calculated | 5.13 % + 1.23 x 5.0 % |
| WACC | 10.98 % | calculated | market-value weights of equity and debt |
| Revenue growth: year 1 / years 2-5 | 21 % / 14 % | assumption | year 1 close to consensus |
| Years 6-10 | fading to 3 % | assumption | - |
| Target free cash flow margin after SBC | 20 % by year 5 | assumption | close to pre-investment-cycle levels |
| Terminal growth / additional dilution | 3.0 % / 0.5 % a year | assumption | Class C shares |
| Result | Value |
|---|---|
| Enterprise value (EV) | $1,084 billion |
| Terminal value share of EV | 59 % |
| + net cash | $1.5 billion |
| Fair value per share | $401 |
| Market price (21.10.2026) | $697.52 |
| Difference from price | -42 % |
| Reverse DCF: required revenue growth in years 2-5 | 25.9 % a year |
| WACC / terminal growth | 2.0 % | 2.5 % | 3.0 % | 3.5 % | 4.0 % |
|---|---|---|---|---|---|
| 8.0 % | 606 | 645 | 692 | 750 | 823 |
| 9.0 % | 505 | 531 | 562 | 598 | 642 |
| 10.0 % | 430 | 448 | 469 | 494 | 522 |
| 11.0 % (base) | 373 | 386 | 401 | 418 | 438 |
| 12.0 % | 326 | 336 | 347 | 359 | 373 |
Fair value is about $401, about 42 % below the current price. The price is reached at a WACC of about 8 % and terminal growth of 3 % (about $692), or with revenue growth of about 26 % a year in years 2-5, against the assumed 14 % and a consensus of about 21 % for 2027. The conclusion: Meta is not cheap. The price assumes either a lower cost of capital or sustained growth above 20 % and a rapid margin recovery after the capital expenditure cycle.
Against Its Own History
The current GAAP P/E of about 24 is close to the five-year average of about 24.9, and the price-to-sales ratio of about 7.4 is close to the average of about 7.3 (Seeking Alpha). Meta is not expensive relative to its history, but nor is it cheap with negative free cash flow.
Analyst Consensus
| Period | Revenue (consensus) | EPS (consensus) | Source |
|---|---|---|---|
| Q4 2026 | ~$73.75 billion | ~$8.28 | Yahoo Finance |
| 2027 | ~$307.1 billion | ~$33.76 | Yahoo Finance |
Source: Yahoo Finance as of 22.10.2026, before the effect of the 2-for-1 split. The Q4 consensus sits in the lower half of the $73-76 billion guidance range. At $33.76, the price is about 21 times expected 2027 earnings.
The Comparative Picture
| Indicator | Tesla | Meta |
|---|---|---|
| Revenue | $28.05 billion | $64.6 billion |
| Revenue growth | almost 0 % | +26 % |
| Share of core segment | ~73 % (automotive) | ~98 % (advertising) |
| Operating margin | 2.6 % | 20 % (GAAP) / ~35 % excluding legal charge |
| Operating cash flow | $6.3 billion | $32.79 billion |
| Capital expenditure | $4.73 billion | ~$34.9 billion |
| Capex as share of operating cash flow | 75 % | 106 % |
| Free cash flow | +$1.53 billion | -$2.12 billion |
| Price/sales ratio | ~12 | ~7.4 |
First Market Reaction
After the reports, Tesla shares fell about 3.3 % in after-hours trading to $373.65, despite better-than-expected revenue and earnings. Meta rose about 2.3 % to $713.80 on revenue and guidance above consensus. The market rewarded growth with a clear link to revenue and punished promises without numbers.
Money and Spectacle
The Roman crowd did not love a gladiator for his past victories, but for as long as he kept on winning.
After the third quarter, Meta enters with the stronger weapon: 26 % growth, high profitability excluding the legal charge and multiples close to their historical norm, although the DCF shows that the price already assumes an optimistic scenario. Its risk is that capital expenditure is already absorbing all of its cash flow. Tesla manages cash flow better, but with an operating margin of 2.6 % and a price about 7 times its DCF value, it is fighting the next battle, not the current one. The next two quarters will show whether Meta turns capital expenditure into revenue and whether Tesla turns Robotaxi into numbers. In the amphitheatre there are no eternal favourites.
Frequently Asked Questions
Why did Tesla report almost unchanged revenue but positive free cash flow?
Revenue was almost unchanged, while operating profitability shrank to 2.6 %. The positive free cash flow of $1.53 billion results from capital expenditure that accounts for 75 % of operating cash flow. If investment returns to previous levels, free cash flow will quickly turn negative. Full-year guidance of about $20 billion leaves about $7.0 billion for the fourth quarter (20 - 2.49 - 5.79 - 4.73), more than the $6.26 billion of operating cash flow in the third quarter. With similar operating cash flow, Q4 free cash flow is likely to be around zero or negative. This is temporary flexibility, not a structural change.
What does Meta’s $9.89 billion legal charge mean, and what does the operating margin show without it?
The charge is one-time, but it is part of an agreement for payments of up to about $18.59 billion, and further cases involving minors are pending in the United States. Without it, operating income would have been about $22.9 billion, a margin of about 35 %, which is still below the 40 % of a year earlier. The gap of about 15 percentage points shows how strongly it distorts the GAAP picture. The core business remains healthy, but the unadjusted figures create a misleading impression.
How vulnerable are the two companies to revenue concentration?
At Tesla, automotive is about 73 % of revenue and is not growing. A 5 % decline in this segment, with the other divisions unchanged, would reduce total revenue by about $1 billion. At Meta, advertising is about 98 %. A 5 % decline in the average price per ad, with impression volume unchanged, would reduce revenue by about $3 billion. In both cases concentration is high. The difference is that at Meta the core segment is growing strongly, while at Tesla it is almost the same as in the previous reporting period.
Why does the market value Tesla shares at a high multiple despite weak operating profitability?
The market is paying for the expected contribution of Full Self-Driving, Robotaxi and Optimus. The current operating margin of 2.6 % and a price-to-sales ratio of about 12 are not justified by the present numbers. To justify the current valuation, Full Self-Driving must contribute substantially to automotive volume and margin over the next four to six quarters. Without that, the multiple is vulnerable.
What is the risk from Reality Labs at Meta, and is the reduction in losses realistic?
Reality Labs generates negligible revenue ($443 million for the quarter) and an operating loss of $4.13 billion. Management expects losses to fall to about $15 billion in 2027 and explicitly links this to redirecting investment toward artificial intelligence. The target is achievable, because a smaller loss requires fewer, not more, resources for Reality Labs. The risk lies elsewhere: if spending is simply shifted to artificial intelligence, group expenses do not fall and free cash flow remains under pressure.
Sources
Tesla Q3 2026 Update, Exhibit 99.1, SEC: https://www.sec.gov/Archives/edgar/data/1318605/000162828026066738/exhibit9914.htm
Tesla Q3 2026 earnings call (21.10.2026): https://stockanalysis.com/stocks/tsla/transcripts/712902-q3-2026/
Meta Reports Third Quarter 2026 Results: https://investor.atmeta.com/investor-news/press-release-details/2026/Meta-Reports-Third-Quarter-2026-Results/default.aspx
Meta Reports Fourth Quarter and Full Year 2025 Results: https://investor.atmeta.com/investor-news/press-release-details/2026/Meta-Reports-Fourth-Quarter-and-Full-Year-2025-Results/default.aspx
LSEG consensus and after-hours reaction: CNBC, 21.10.2026
Tesla Q3 2026 Update (IR): https://assets-ir.tesla.com/tesla-contents/IR/TSLA-Q3-2026-Update.pdf
Consensus: https://finance.yahoo.com/quote/TSLA/analysis/ ; https://finance.yahoo.com/quote/META/analysis/ ; https://www.wsj.com/market-data/quotes/TSLA/research-ratings
Historical multiples: https://www.alphaspread.com/security/nasdaq/tsla/relative-valuation/ratio/price-to-sales ; https://seekingalpha.com/symbol/META/valuation/metrics ; https://www.financecharts.com/compare/TSLA,META/value/pe-ratio
Robotaxi/Optimus timelines: https://teslanorth.com/2026/10/21/tesla-q3-2026-call-takeaways/ ; https://www.cnbc.com/2026/10/21/tesla-tsla-q3-2026-earnings-report.html
DCF inputs: US Treasury Daily Par Yield Curve (21.10.2026): https://home.treasury.gov/resource-center/data-chart-center/interest-rates/ ; beta: https://finance.yahoo.com/quote/TSLA/ and https://uk.finance.yahoo.com/quote/META.SN/key-statistics/ ; Meta FY2025: https://www.sec.gov/Archives/edgar/data/1326801/000162828026003832/meta-12312025xexhibit991.htm
Important notice
This article is for information and education only. It is not financial advice, an investment recommendation or professional advice of any kind. The views expressed are the author’s personal opinions and are not recommendations to buy, sell or hold securities, assets or investments. Investing involves substantial risk, including the possible loss of all capital. Past performance is not a guarantee of future results. Each reader should conduct independent research, consult a qualified financial adviser and weigh financial circumstances, risk tolerance and investment objectives before taking any decision. The author and borsite.net accept no liability for any loss arising from the use of the information in this article.
Leave a Reply
Трябва да влезете или да се регистрирате, за да публикувате коментар.